 8
8peptides
spectra
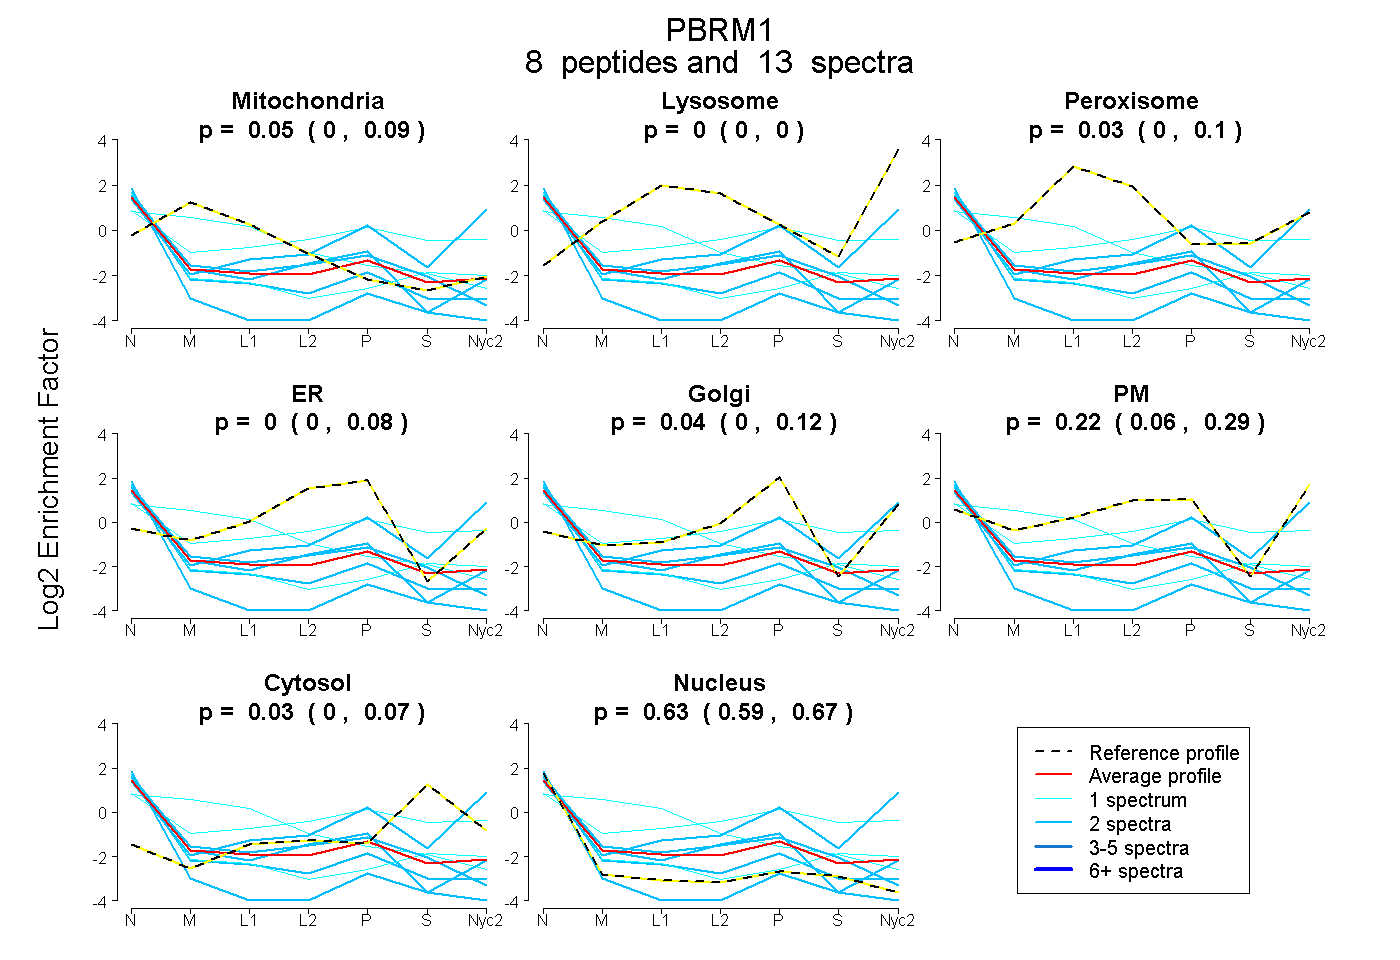
0.000 | 0.091
0.000 | 0.000
0.000 | 0.104
0.000 | 0.076
0.000 | 0.124
0.057 | 0.291
0.000 | 0.071
0.593 | 0.673
| Plot | Mito | Lyso | Perox | ER | Golgi | PM | Cytosol | Nucleus | |||||
| Expt A |
8 peptides |
13 spectra |
|
0.047 0.000 | 0.091 |
0.000 0.000 | 0.000 |
0.028 0.000 | 0.104 |
0.000 0.000 | 0.076 |
0.041 0.000 | 0.124 |
0.219 0.057 | 0.291 |
0.032 0.000 | 0.071 |
0.634 0.593 | 0.673 |
| 2 spectra, DVPLPVVR | 0.000 | 0.000 | 0.000 | 0.000 | 0.000 | 0.000 | 0.000 | 1.000 | ||
| 2 spectra, LLCELFIR | 0.064 | 0.000 | 0.000 | 0.011 | 0.053 | 0.058 | 0.000 | 0.814 | ||
| 1 spectrum, LNEVYEAVK | 0.000 | 0.113 | 0.000 | 0.000 | 0.000 | 0.000 | 0.098 | 0.789 | ||
| 2 spectra, SHGLVRPR | 0.075 | 0.000 | 0.052 | 0.217 | 0.000 | 0.000 | 0.002 | 0.654 | ||
| 2 spectra, LWEDSAGEK | 0.000 | 0.000 | 0.000 | 0.000 | 0.112 | 0.512 | 0.134 | 0.243 | ||
| 1 spectrum, ELGPLPDDDDMASPK | 0.628 | 0.000 | 0.153 | 0.008 | 0.000 | 0.000 | 0.000 | 0.212 | ||
| 2 spectra, IIEHNIR | 0.000 | 0.000 | 0.000 | 0.197 | 0.000 | 0.159 | 0.000 | 0.645 | ||
| 1 spectrum, HLHNDVEK | 0.000 | 0.000 | 0.063 | 0.018 | 0.000 | 0.439 | 0.324 | 0.155 |
| Plot | Lyso | Other | |||||||||||
| Expt C |
1 peptide |
2 spectra |
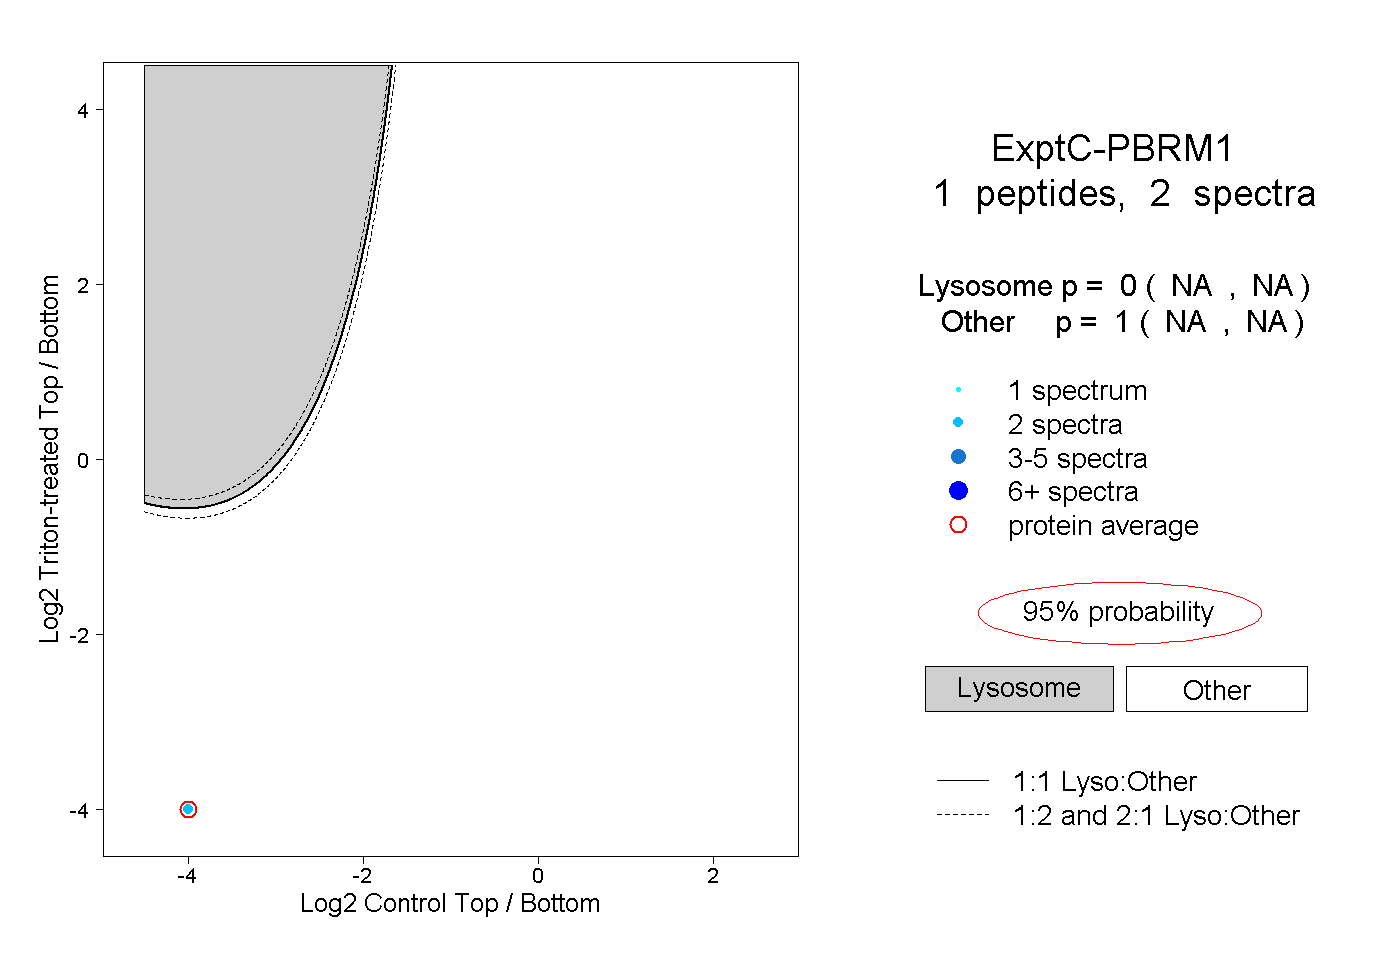 |
0.000 NA | NA |
1.000 NA | NA |