39
39peptides
spectra
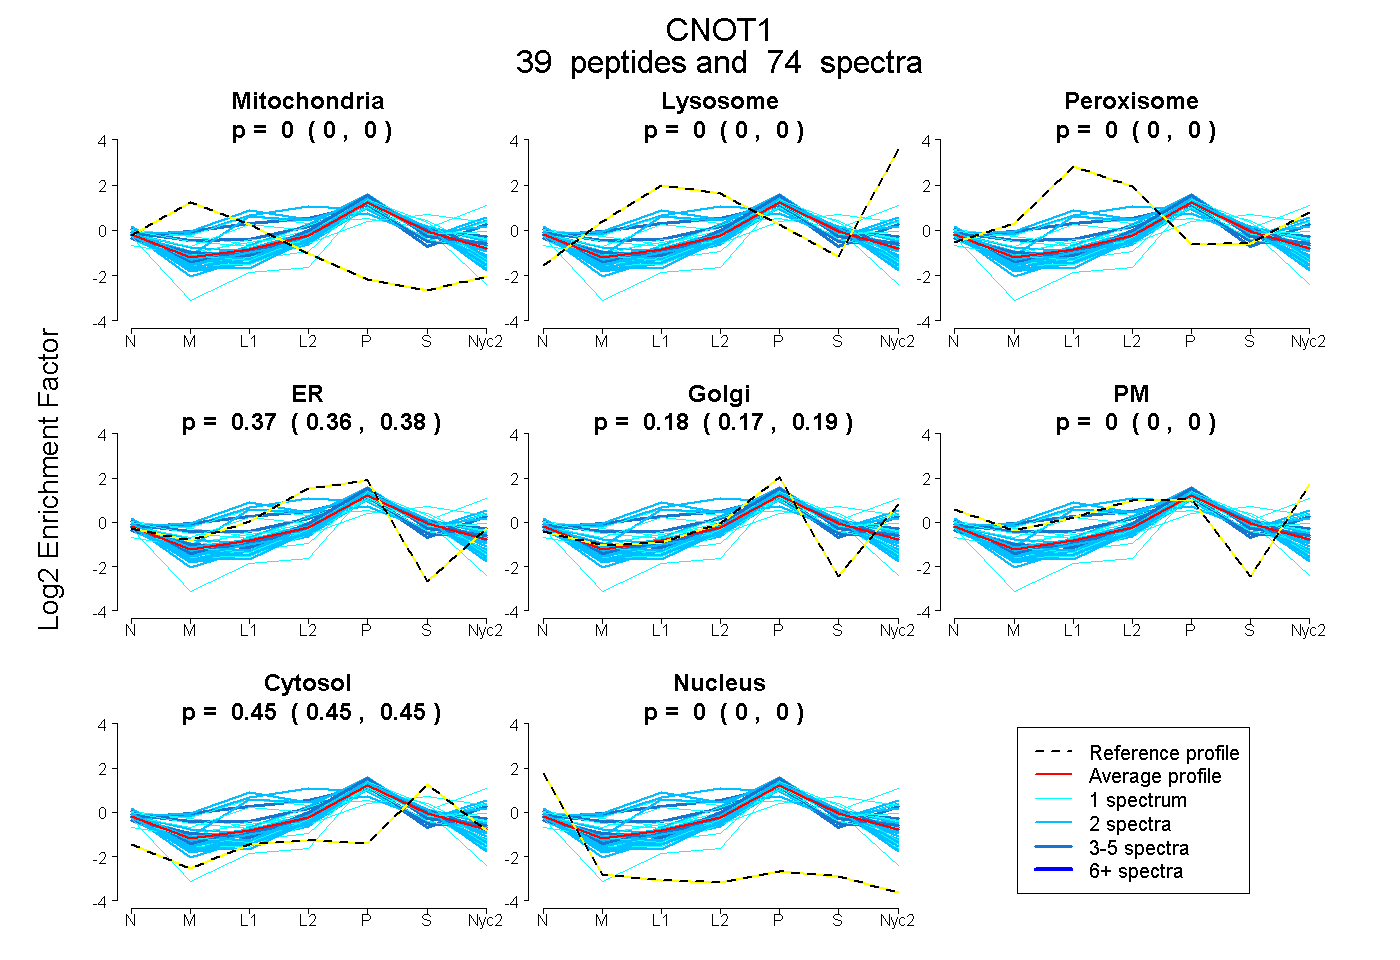
0.000 | 0.000
0.000 | 0.000
0.000 | 0.000
0.358 | 0.375
0.172 | 0.191
0.000 | 0.000
0.448 | 0.452
0.000 | 0.000
9peptides
spectra
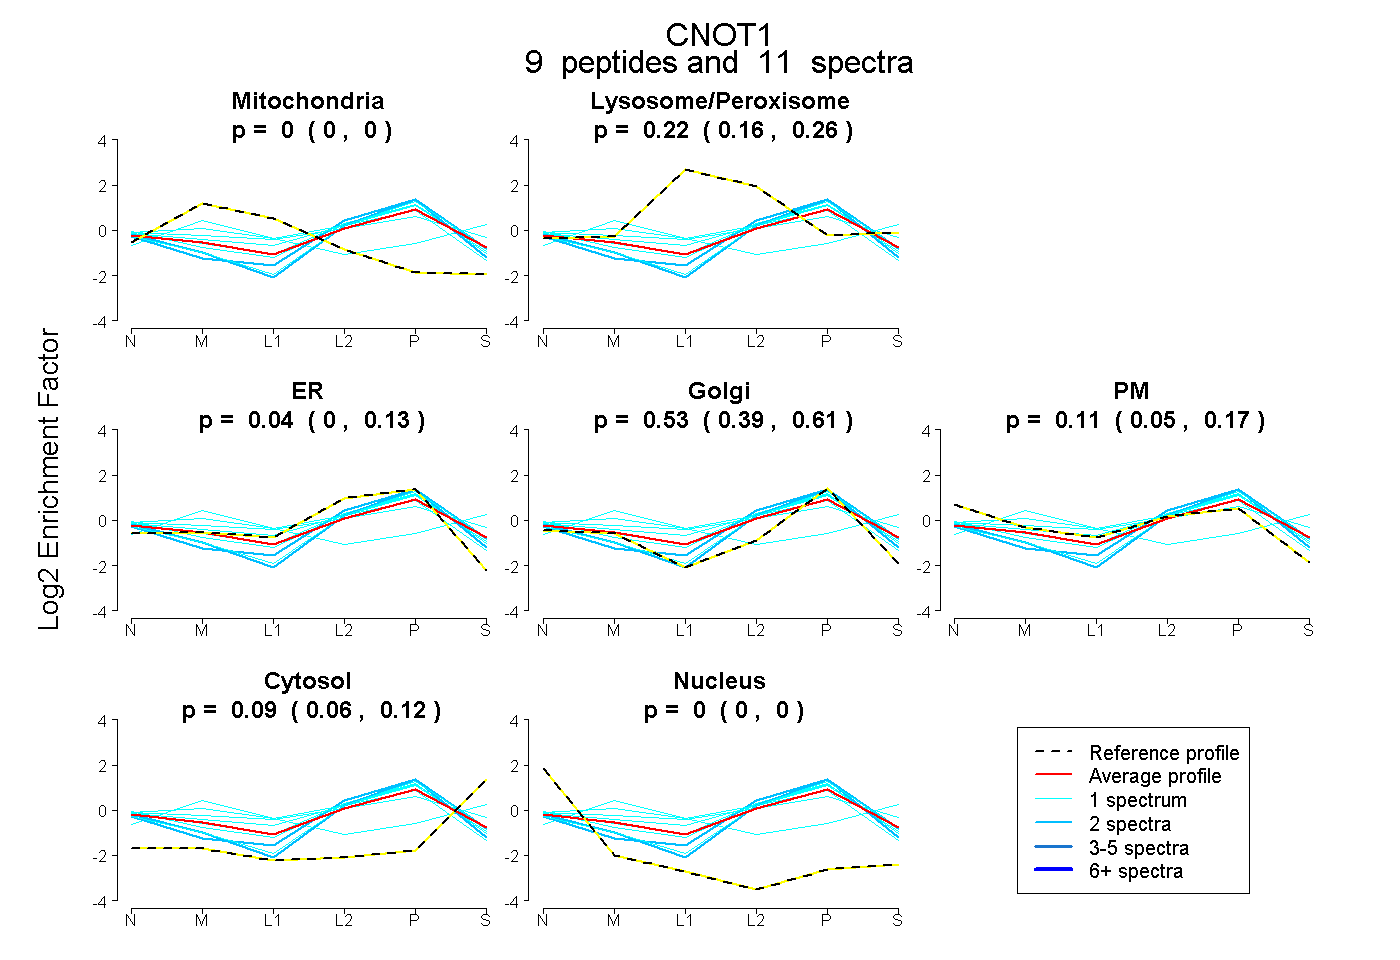
0.000 | 0.000
0.160 | 0.256
0.000 | 0.135
0.394 | 0.613
0.051 | 0.169
0.061 | 0.123
0.000 | 0.000
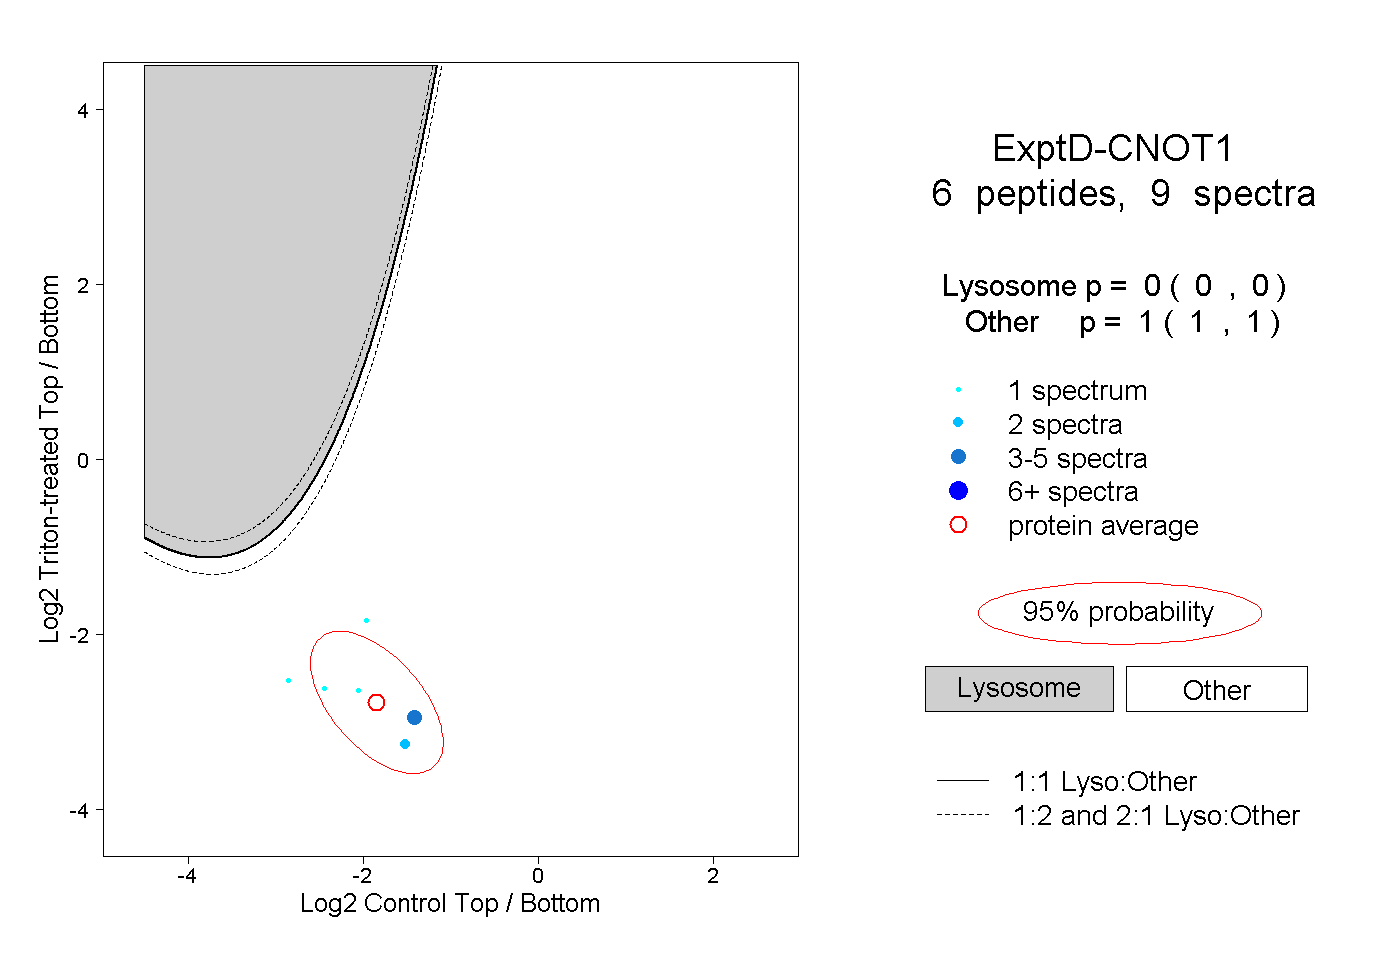
21peptides
spectra
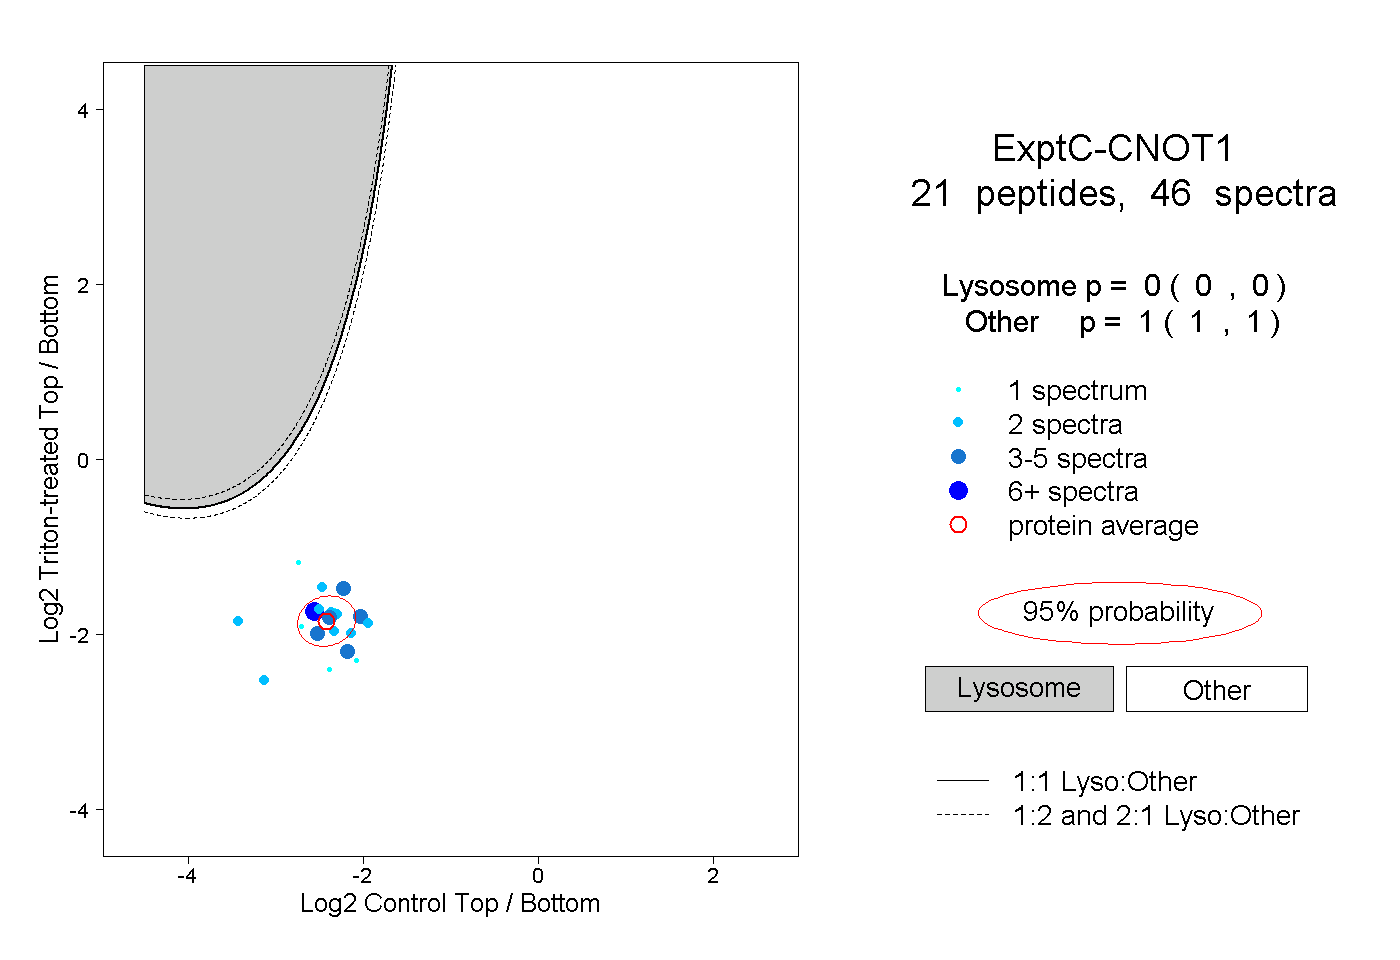
0.000 | 0.000
1.000 | 1.000