CNOT1
[ENSRNOP00000016563]
Main page
| | | Plot |
Mito |
Lyso |
|
Perox |
ER |
Golgi |
PM |
Cytosol |
Nucleus |
|
| Expt A |
 39
39
peptides |
74
spectra |
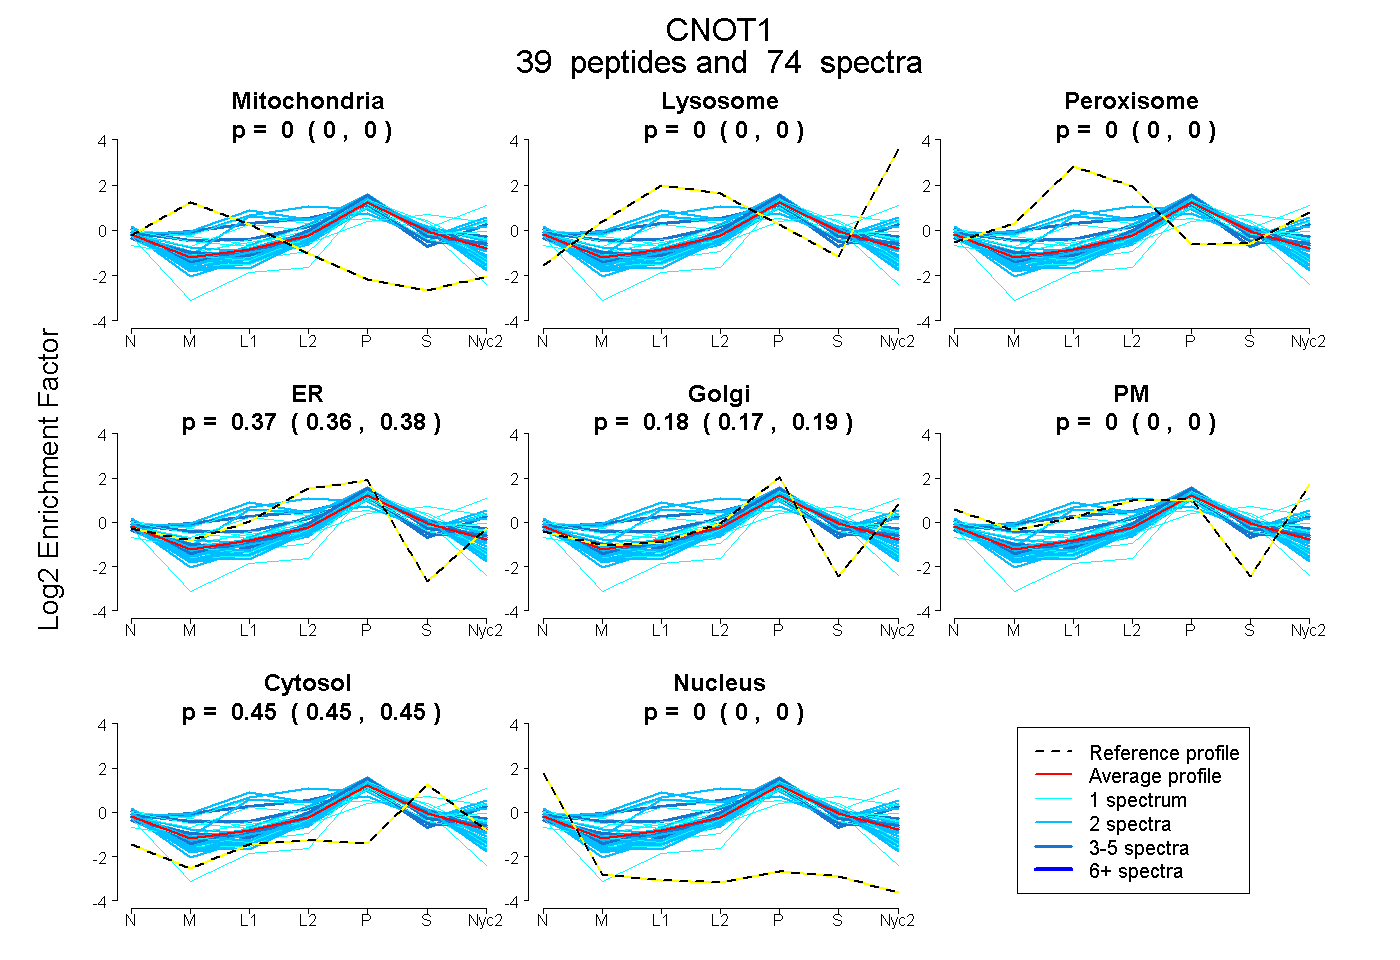 |
0.000
0.000 | 0.000 |
0.000
0.000 | 0.000 |
|
0.000
0.000 | 0.000 |
0.368
0.358 | 0.375 |
0.182
0.172 | 0.191 |
0.000
0.000 | 0.000 |
0.450
0.448 | 0.452 |
0.000
0.000 | 0.000 |
|
| | | Plot |
Mito |
|
Lyso or Perox |
|
ER |
Golgi |
PM |
Cytosol |
Nucleus |
|
| Expt B |
9
peptides |
11
spectra |
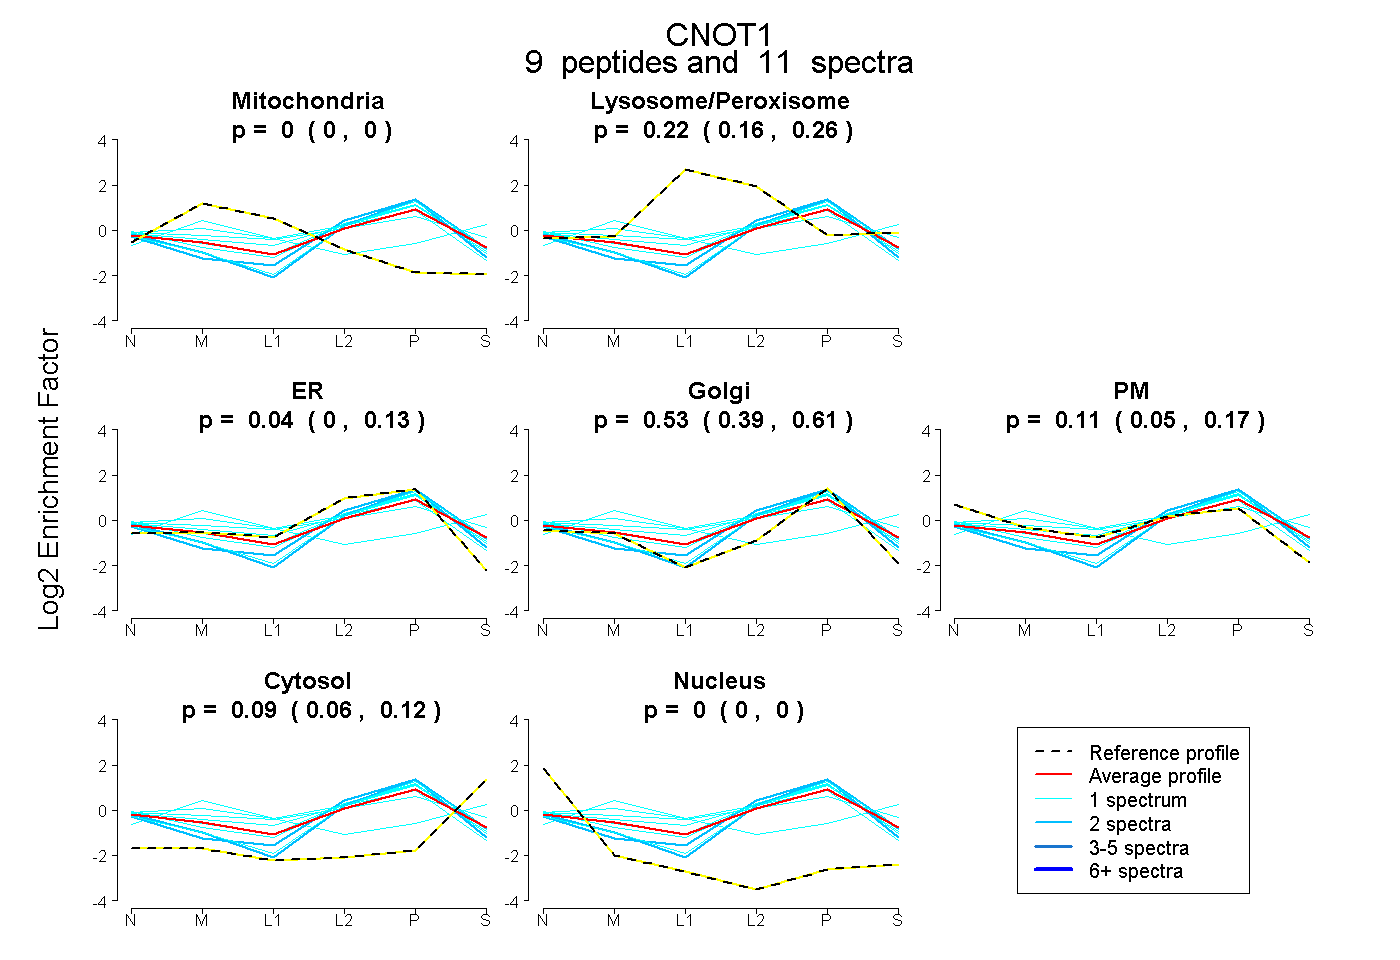 |
0.000
0.000 | 0.000 |
|
0.221
0.160 | 0.256 |
|
0.044
0.000 | 0.135 |
0.529
0.394 | 0.613 |
0.115
0.051 | 0.169 |
0.091
0.061 | 0.123 |
0.000
0.000 | 0.000 |
|
| 1 spectrum, AVQELVHPVVDR |
0.000 |
|
0.329 |
|
0.000 |
0.357 |
0.177 |
0.137 |
0.000 |
|
| 1 spectrum, SPVTFLSDLR |
0.000 |
|
0.000 |
|
0.450 |
0.368 |
0.004 |
0.178 |
0.000 |
|
| 1 spectrum, GLHNVVYGIQR |
0.306 |
|
0.193 |
|
0.000 |
0.151 |
0.000 |
0.351 |
0.000 |
|
| 2 spectra, ILDVAQDLK |
0.000 |
|
0.000 |
|
0.623 |
0.195 |
0.001 |
0.180 |
0.000 |
|
| 1 spectrum, ILLVDER |
0.000 |
|
0.180 |
|
0.180 |
0.475 |
0.119 |
0.046 |
0.000 |
|
| 1 spectrum, NLILSAFPR |
0.040 |
|
0.254 |
|
0.051 |
0.394 |
0.262 |
0.000 |
0.000 |
|
| 2 spectra, SLDLIESLLR |
0.000 |
|
0.000 |
|
0.387 |
0.498 |
0.021 |
0.095 |
0.000 |
|
| 1 spectrum, DFALDSEESR |
0.000 |
|
0.144 |
|
0.187 |
0.415 |
0.163 |
0.091 |
0.000 |
|
| 1 spectrum, NSFASALR |
0.000 |
|
0.313 |
|
0.000 |
0.622 |
0.061 |
0.005 |
0.000 |
|
| | | Plot |
|
Lyso |
|
|
|
|
|
|
|
Other |
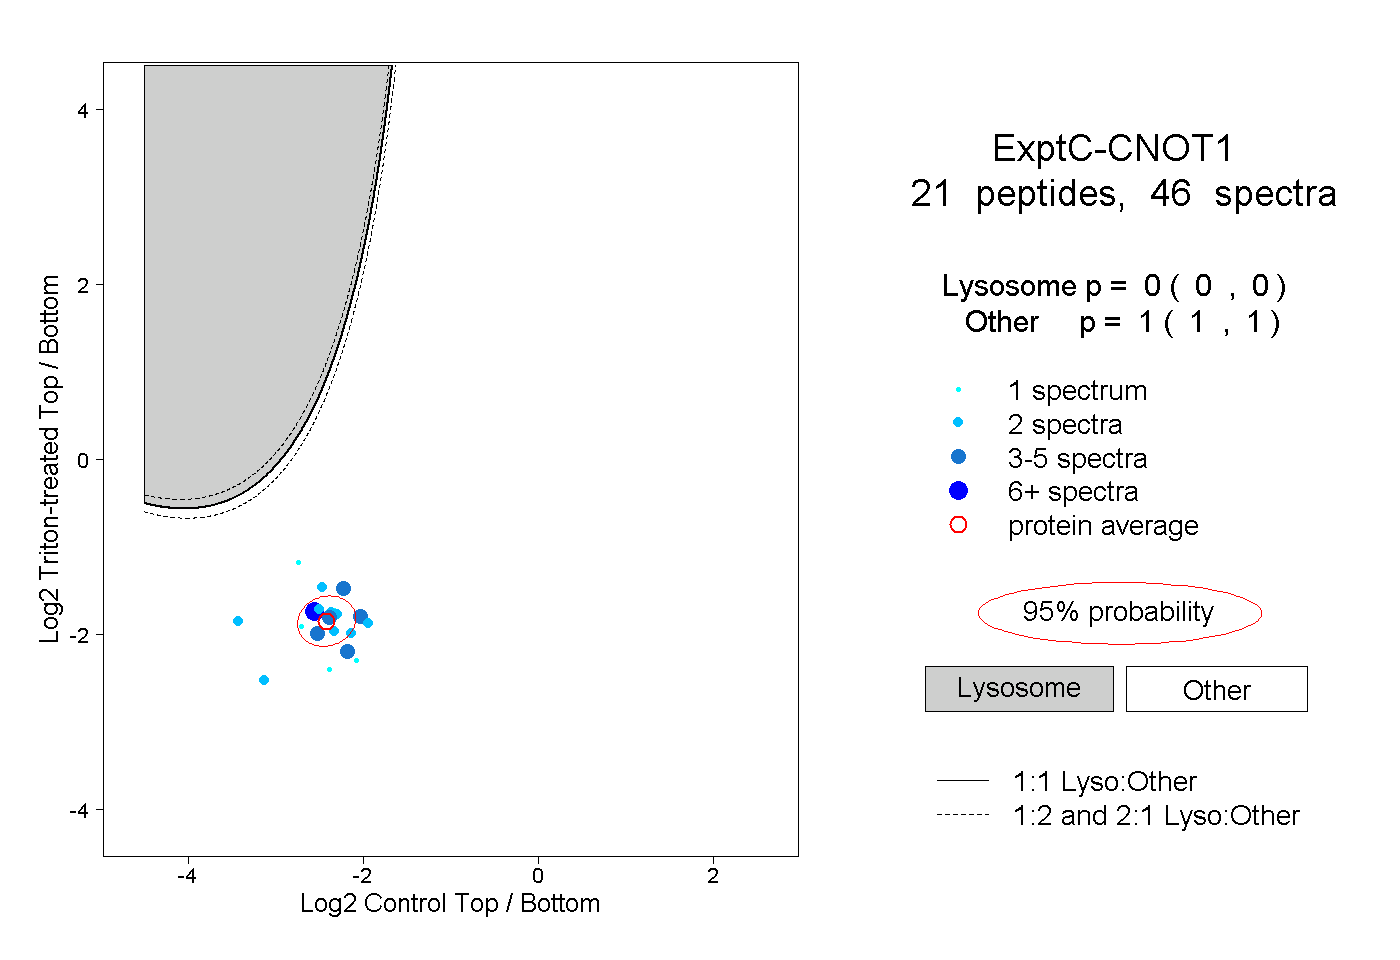
| Expt C |
21
peptides |
46
spectra |
 |
|
0.000
0.000 | 0.000 |
|
|
|
|
|
|
|
1.000
1.000 | 1.000 |
| | | Plot |
|
Lyso |
|
|
|
|
|
|
|
Other |
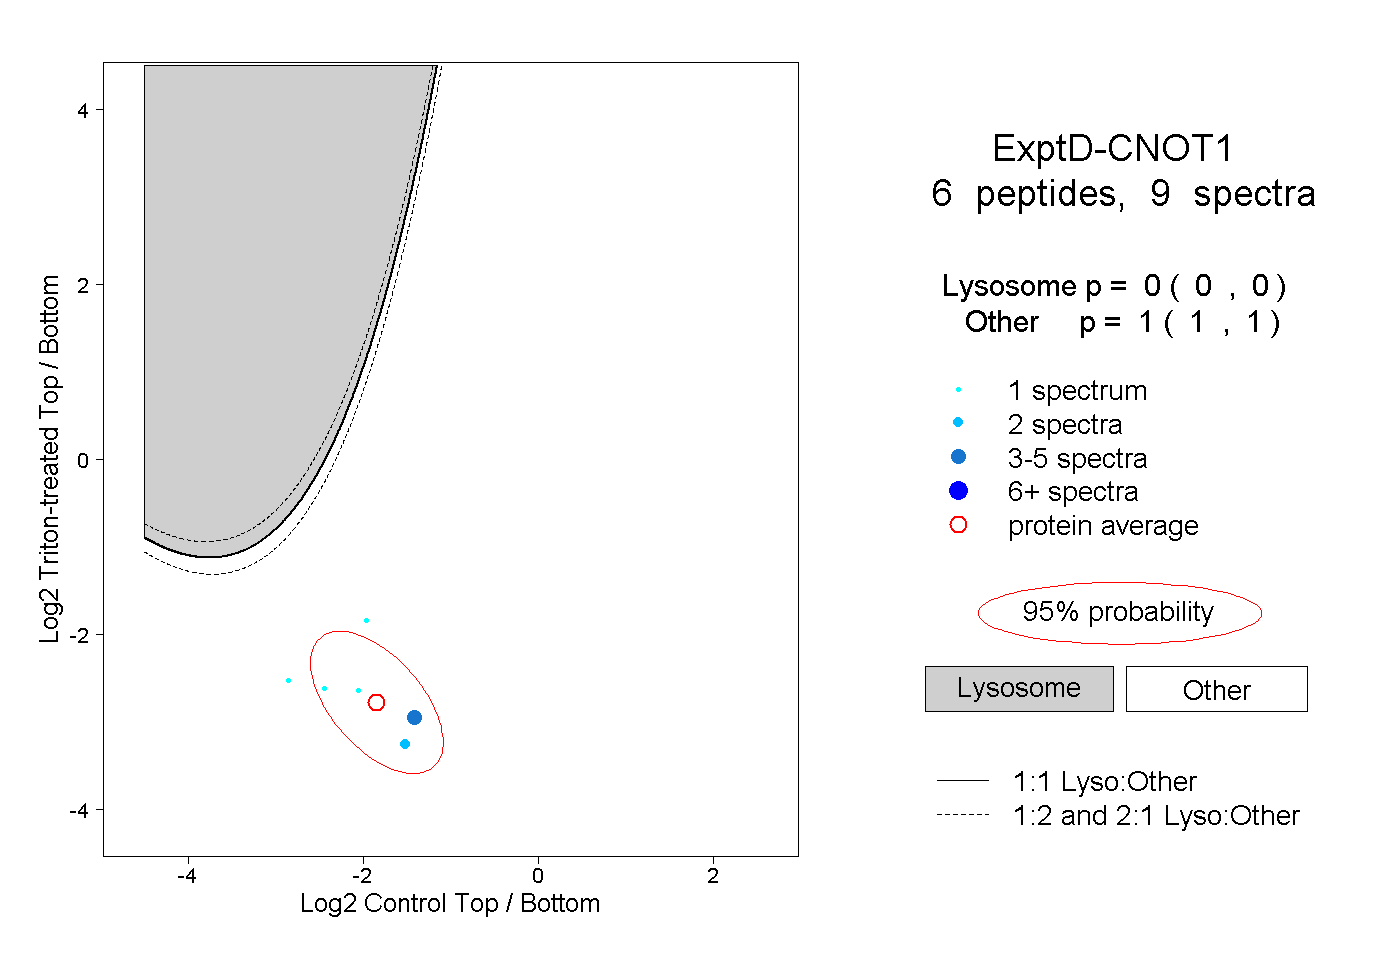
| Expt D |
6
peptides |
9
spectra |
 |
|
0.000
0.000 | 0.000 |
|
|
|
|
|
|
|
1.000
1.000 | 1.000 |