20
20peptides
spectra
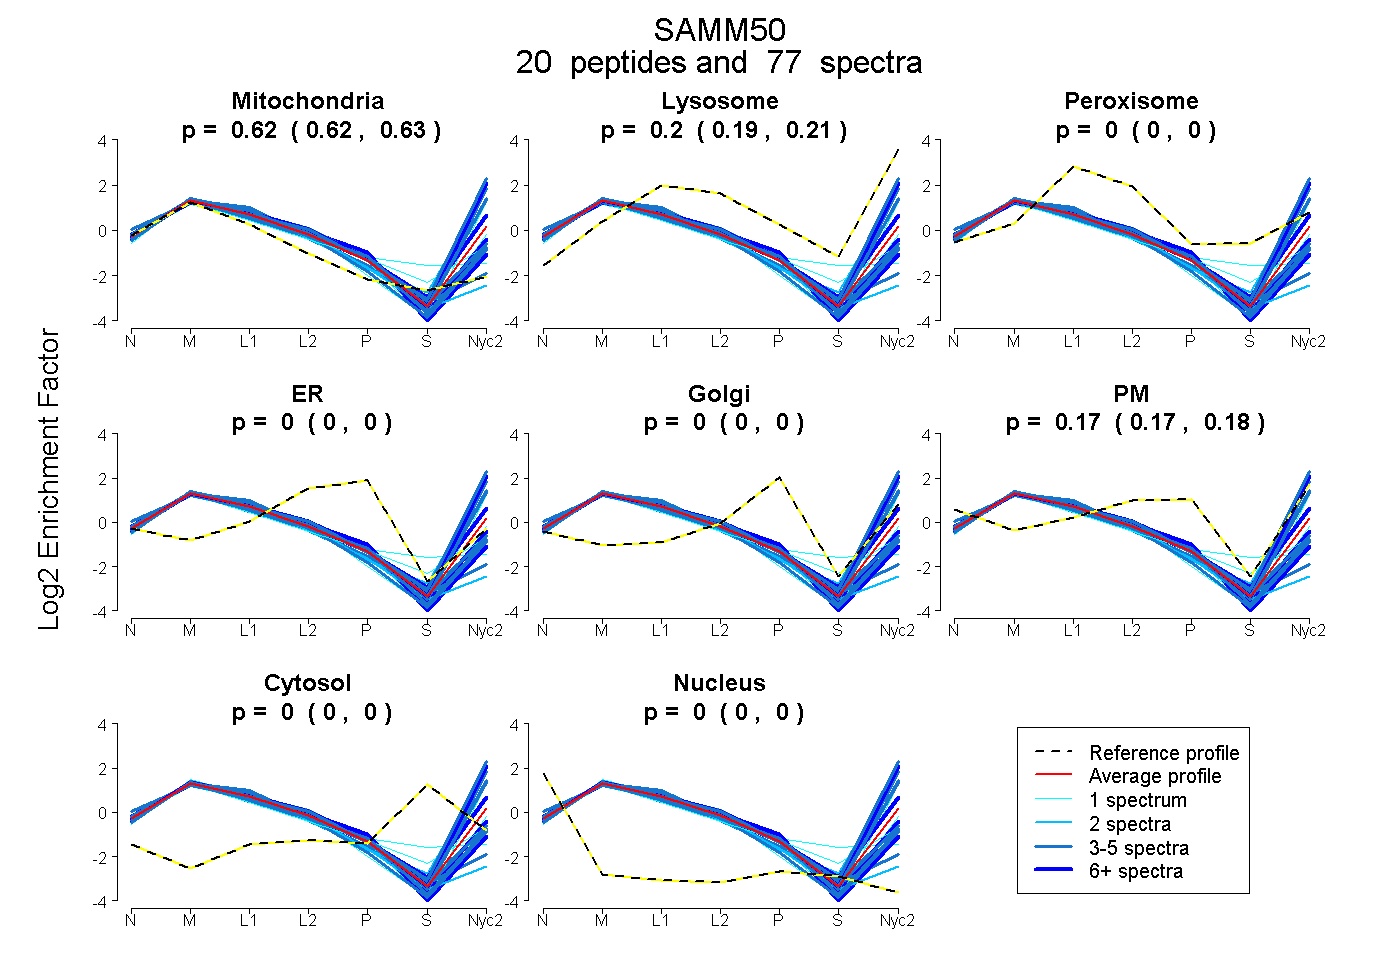
0.615 | 0.631
0.193 | 0.209
0.000 | 0.000
0.000 | 0.000
0.000 | 0.000
0.171 | 0.177
0.000 | 0.000
0.000 | 0.000
14peptides
spectra
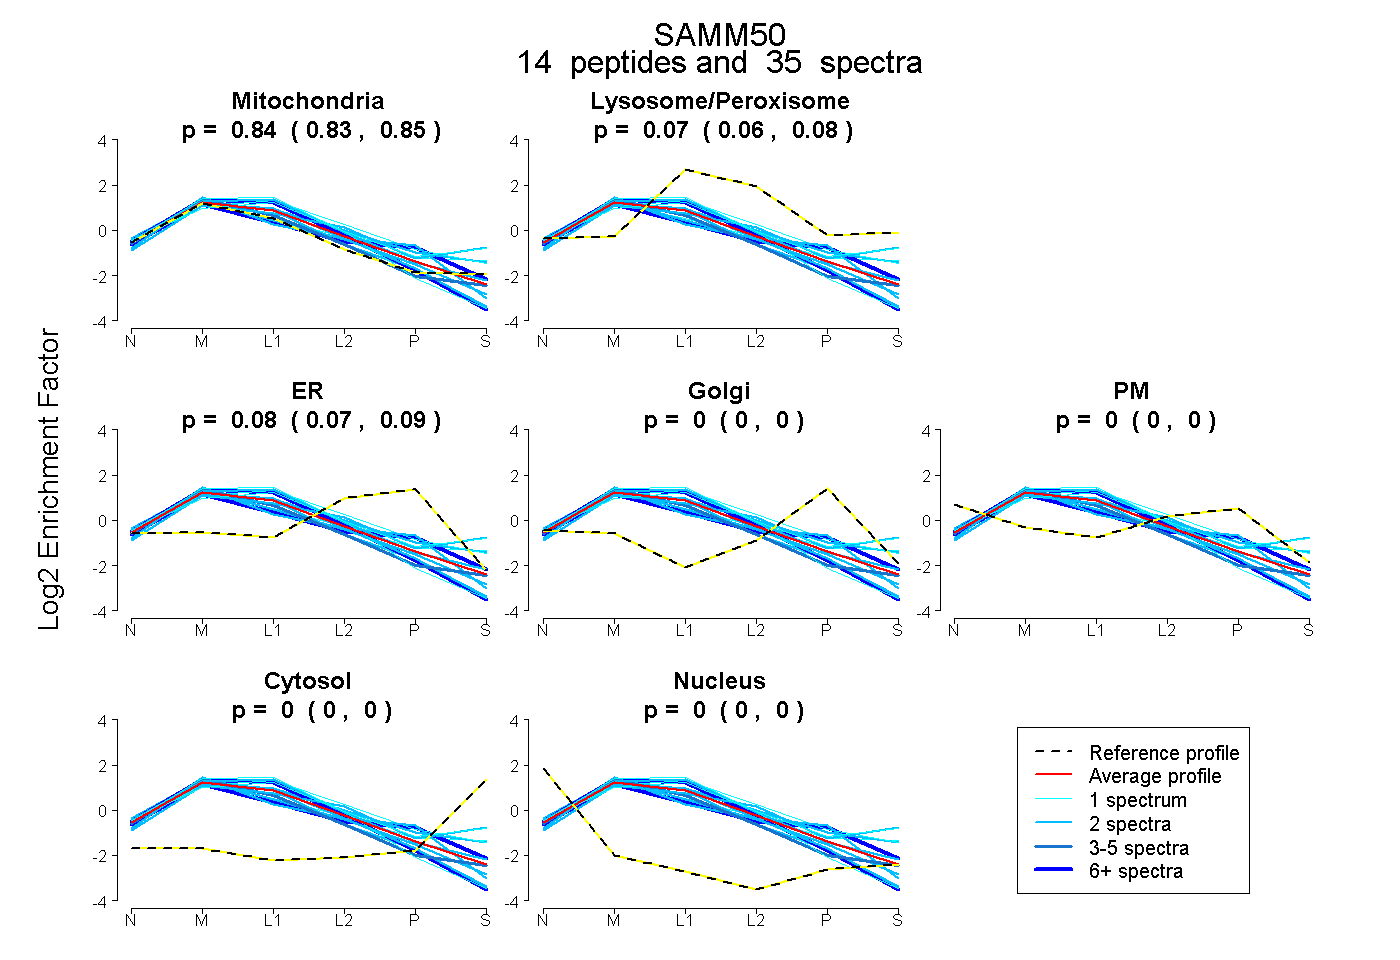
0.835 | 0.853
0.059 | 0.082
0.073 | 0.094
0.000 | 0.000
0.000 | 0.000
0.000 | 0.000
0.000 | 0.000