 20
20peptides
spectra
0.615 | 0.631
0.193 | 0.209
0.000 | 0.000
0.000 | 0.000
0.000 | 0.000
0.171 | 0.177
0.000 | 0.000
0.000 | 0.000
| Plot | Mito | Lyso | Perox | ER | Golgi | PM | Cytosol | Nucleus | |||||
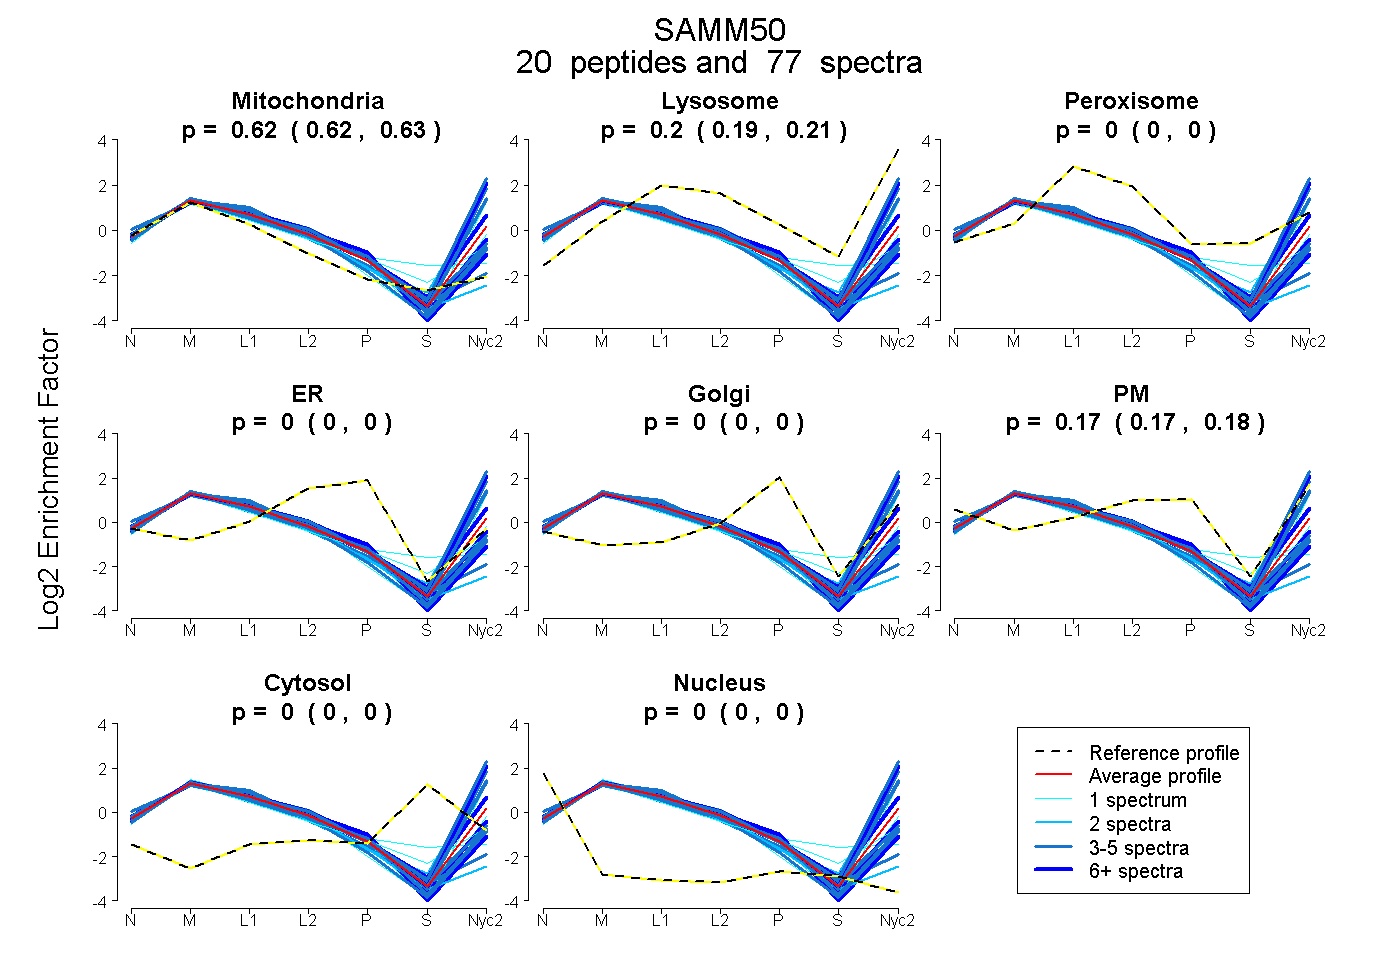
| Expt A |
20 peptides |
77 spectra |
|
0.624 0.615 | 0.631 |
0.202 0.193 | 0.209 |
0.000 0.000 | 0.000 |
0.000 0.000 | 0.000 |
0.000 0.000 | 0.000 |
0.175 0.171 | 0.177 |
0.000 0.000 | 0.000 |
0.000 0.000 | 0.000 |
| 3 spectra, NLIEVMR | 0.706 | 0.127 | 0.000 | 0.097 | 0.000 | 0.070 | 0.000 | 0.000 | ||
| 2 spectra, LELNYCIPMGVQR | 0.911 | 0.000 | 0.000 | 0.089 | 0.000 | 0.000 | 0.000 | 0.000 | ||
| 4 spectra, NFSVNLYK | 0.408 | 0.339 | 0.000 | 0.000 | 0.000 | 0.253 | 0.000 | 0.000 | ||
| 3 spectra, LSSIADR | 0.790 | 0.039 | 0.000 | 0.000 | 0.000 | 0.171 | 0.000 | 0.000 | ||
| 3 spectra, NSSILPR | 0.460 | 0.283 | 0.000 | 0.000 | 0.000 | 0.257 | 0.000 | 0.000 | ||
| 6 spectra, ICDGVQFGAGIR | 0.703 | 0.002 | 0.000 | 0.149 | 0.000 | 0.146 | 0.000 | 0.000 | ||
| 1 spectrum, LTGSYNTMVGNNEGSMVLGLK | 0.718 | 0.150 | 0.000 | 0.000 | 0.000 | 0.132 | 0.000 | 0.000 | ||
| 3 spectra, VTFQFSYGTK | 0.441 | 0.381 | 0.000 | 0.000 | 0.000 | 0.178 | 0.000 | 0.000 | ||
| 1 spectrum, GVSAEYSFPLCK | 0.519 | 0.270 | 0.000 | 0.000 | 0.000 | 0.211 | 0.000 | 0.000 | ||
| 4 spectra, TASFAVR | 0.694 | 0.121 | 0.000 | 0.019 | 0.000 | 0.166 | 0.000 | 0.000 | ||
| 5 spectra, ELGCLAR | 0.760 | 0.138 | 0.000 | 0.000 | 0.000 | 0.102 | 0.000 | 0.000 | ||
| 3 spectra, WSYGAGIVLR | 0.493 | 0.346 | 0.000 | 0.000 | 0.000 | 0.162 | 0.000 | 0.000 | ||
| 1 spectrum, DVVVQHVHFDGLER | 0.751 | 0.227 | 0.000 | 0.000 | 0.000 | 0.021 | 0.000 | 0.000 | ||
| 8 spectra, FYLGGPTSVR | 0.679 | 0.083 | 0.000 | 0.000 | 0.000 | 0.238 | 0.000 | 0.000 | ||
| 4 spectra, IAECLR | 0.864 | 0.000 | 0.002 | 0.134 | 0.000 | 0.000 | 0.000 | 0.000 | ||
| 4 spectra, WEGVWR | 0.396 | 0.490 | 0.000 | 0.000 | 0.000 | 0.114 | 0.000 | 0.000 | ||
| 12 spectra, VTGQFPWSSLR | 0.406 | 0.427 | 0.000 | 0.000 | 0.000 | 0.167 | 0.000 | 0.000 | ||
| 1 spectrum, DDIIICEIGEVFK | 0.657 | 0.000 | 0.217 | 0.072 | 0.000 | 0.000 | 0.054 | 0.000 | ||
| 2 spectra, LGNIAR | 0.490 | 0.440 | 0.000 | 0.000 | 0.000 | 0.070 | 0.000 | 0.000 | ||
| 7 spectra, LPNLLGR | 0.566 | 0.267 | 0.000 | 0.000 | 0.000 | 0.167 | 0.000 | 0.000 |
| Plot | Mito | Lyso or Perox | ER | Golgi | PM | Cytosol | Nucleus | ||||||
| Expt B |
14 peptides |
35 spectra |
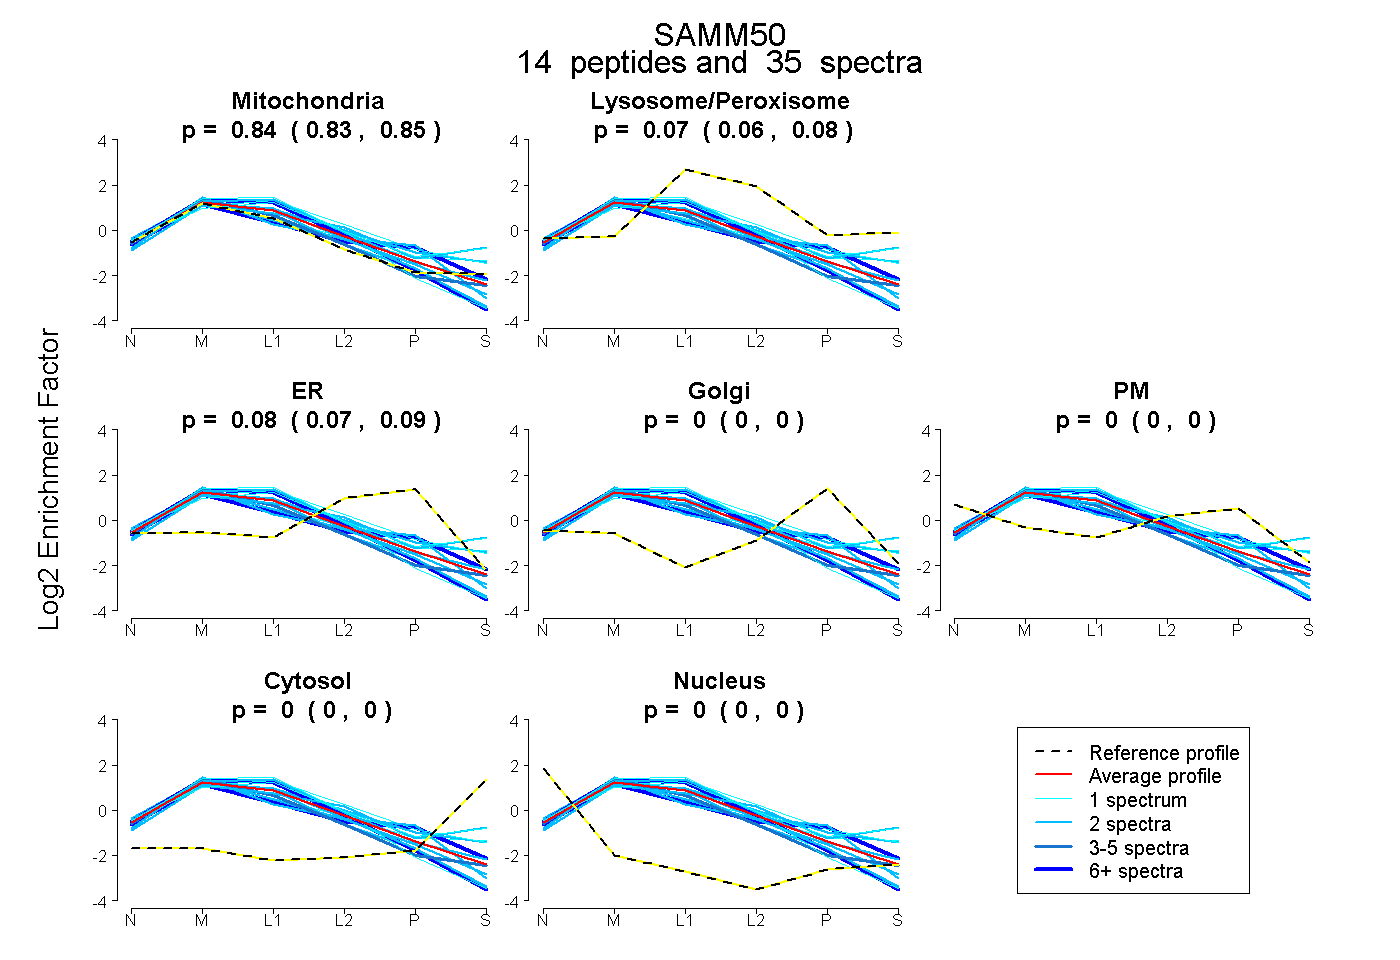 |
0.845 0.835 | 0.853 |
0.071 0.059 | 0.082 |
0.084 0.073 | 0.094 |
0.000 0.000 | 0.000 |
0.000 0.000 | 0.000 |
0.000 0.000 | 0.000 |
0.000 0.000 | 0.000 |
|||
| Plot | Lyso | Other | |||||||||||
| Expt C |
23 peptides |
191 spectra |
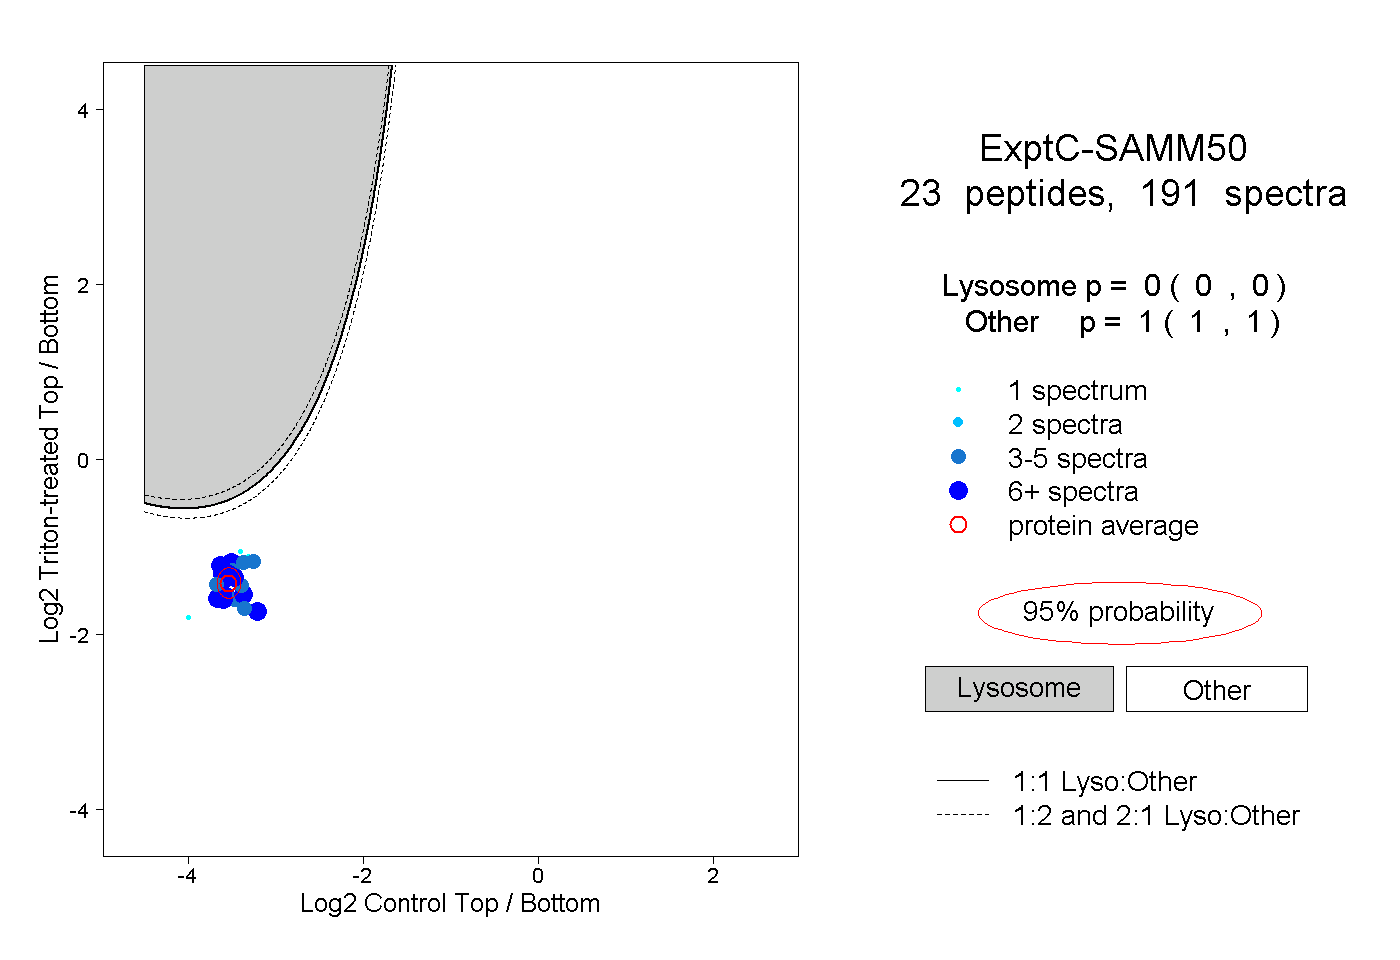 |
0.000 0.000 | 0.000 |
1.000 1.000 | 1.000 |
||||||||
| Plot | Lyso | Other | |||||||||||
| Expt D |
14 peptides |
36 spectra |
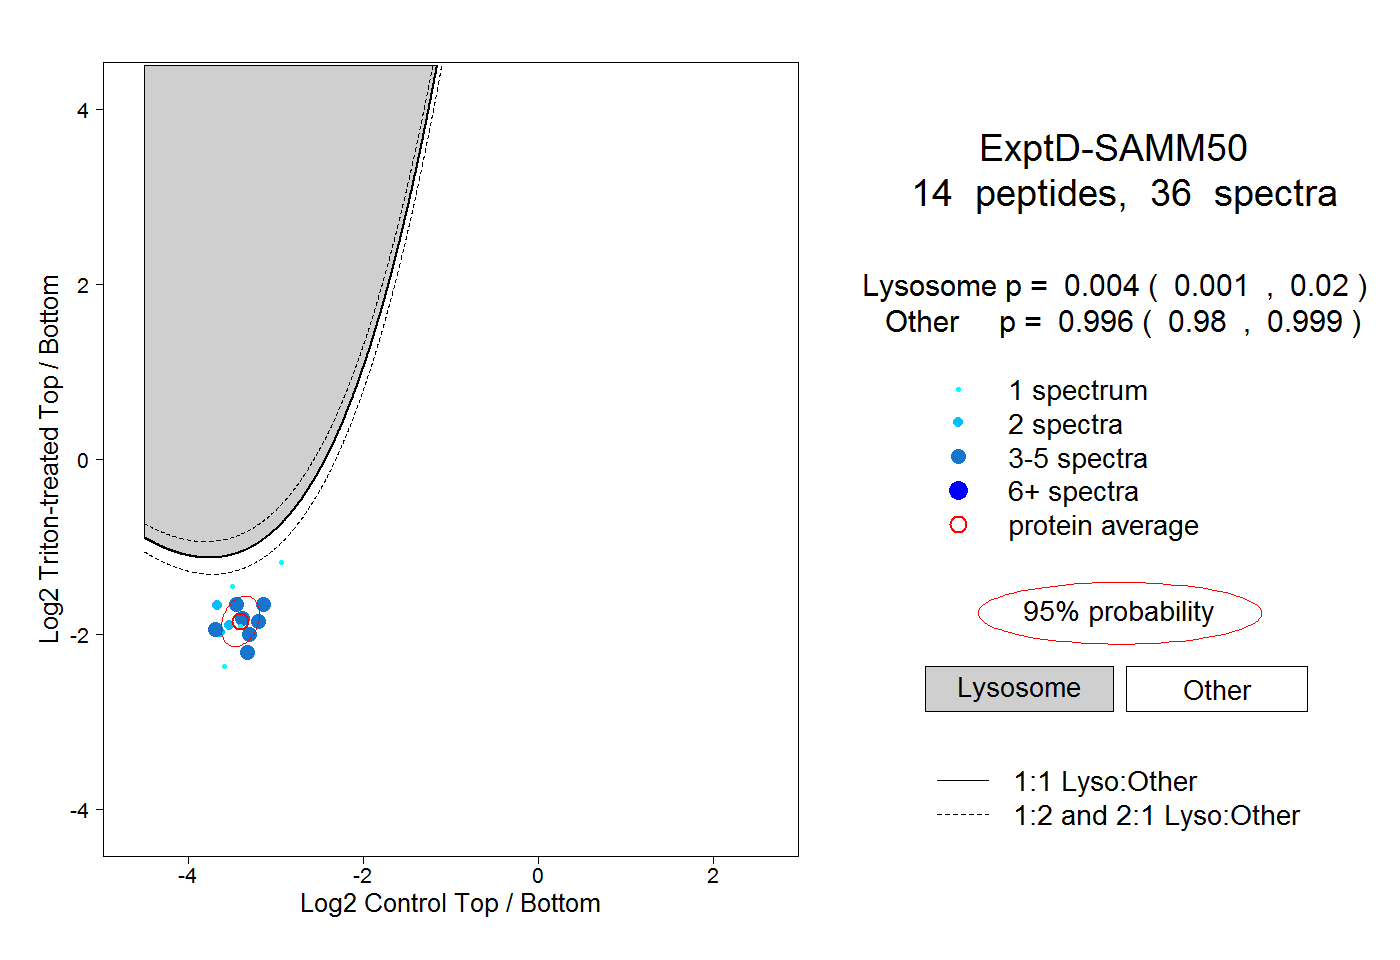 |
0.004 0.001 | 0.020 |
0.996 0.980 | 0.999 |