9
9peptides
spectra
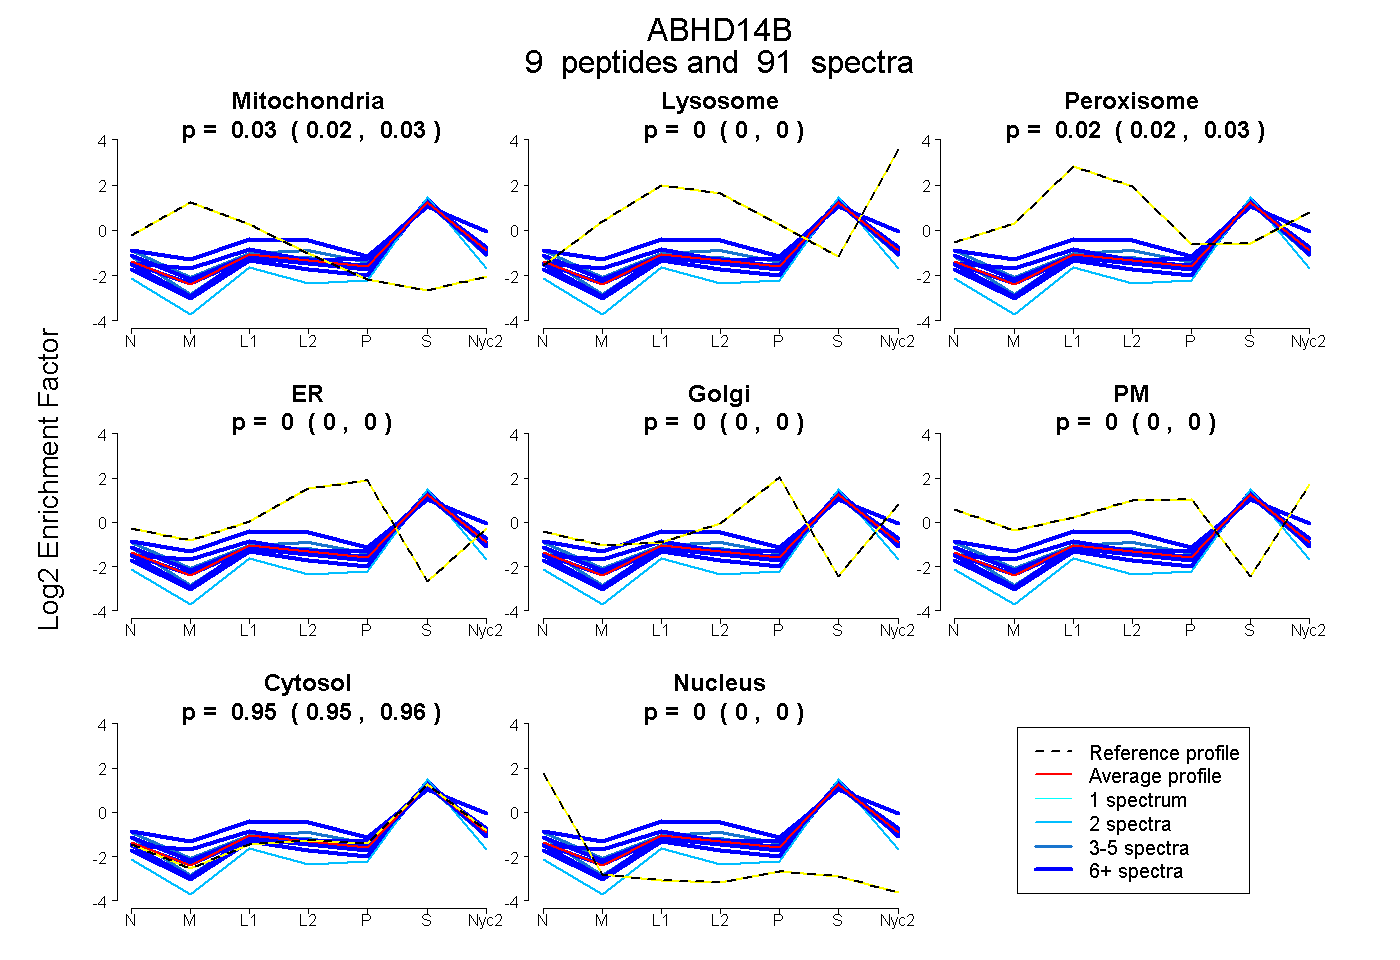
0.021 | 0.033
0.000 | 0.000
0.016 | 0.025
0.000 | 0.000
0.000 | 0.000
0.000 | 0.000
0.946 | 0.956
0.000 | 0.000
8peptides
spectra
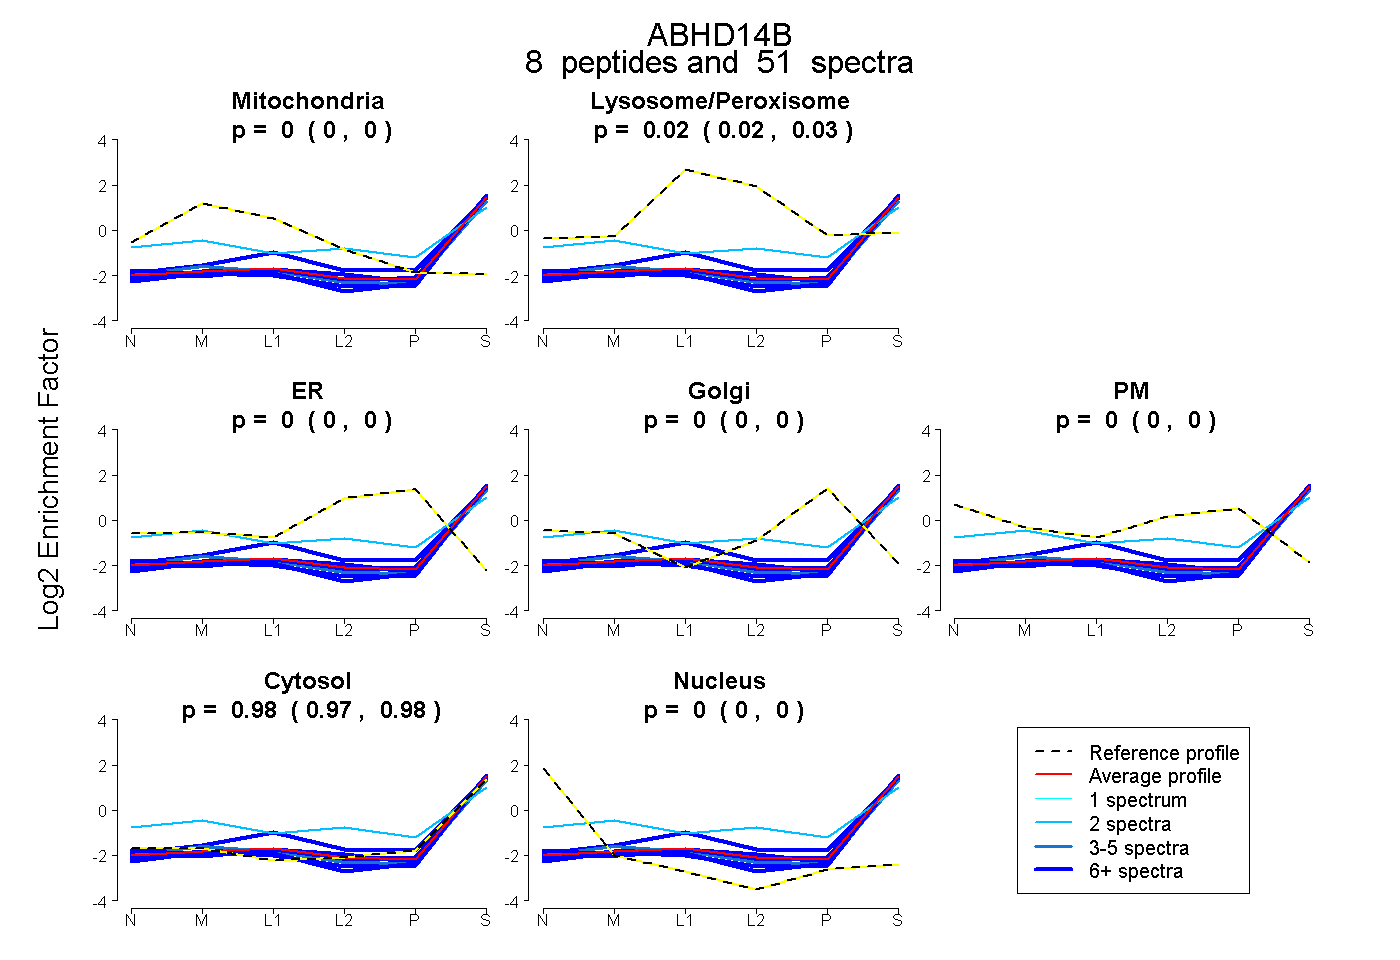
0.000 | 0.000
0.017 | 0.028
0.000 | 0.000
0.000 | 0.000
0.000 | 0.000
0.972 | 0.981
0.000 | 0.000