 9
9peptides
spectra
0.021 | 0.033
0.000 | 0.000
0.016 | 0.025
0.000 | 0.000
0.000 | 0.000
0.000 | 0.000
0.946 | 0.956
0.000 | 0.000
| Plot | Mito | Lyso | Perox | ER | Golgi | PM | Cytosol | Nucleus | |||||
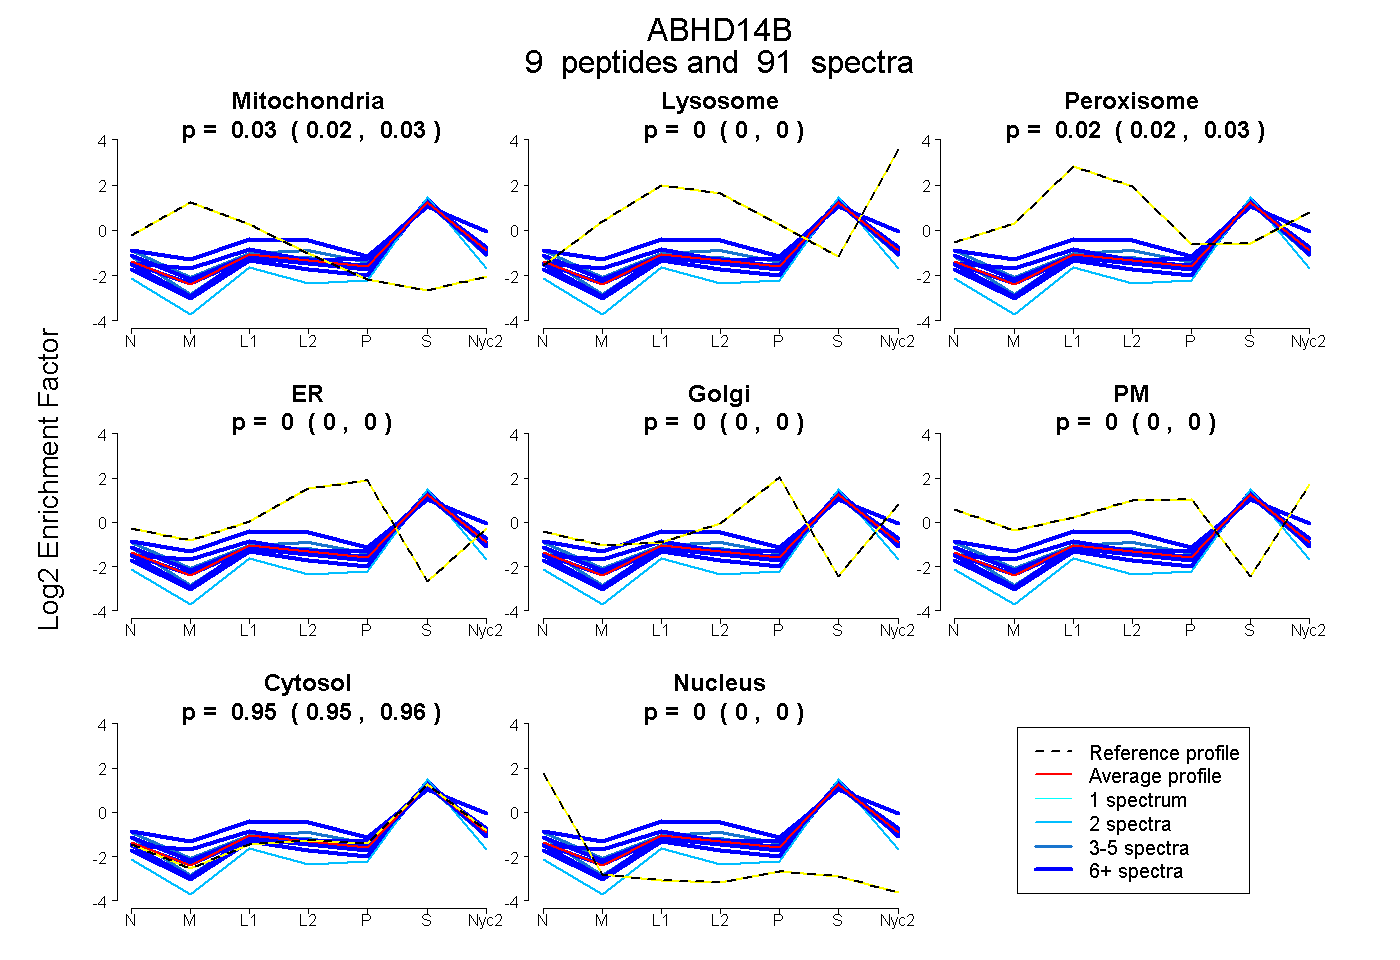
| Expt A |
9 peptides |
91 spectra |
|
0.028 0.021 | 0.033 |
0.000 0.000 | 0.000 |
0.021 0.016 | 0.025 |
0.000 0.000 | 0.000 |
0.000 0.000 | 0.000 |
0.000 0.000 | 0.000 |
0.951 0.946 | 0.956 |
0.000 0.000 | 0.000 |
| 7 spectra, QLPNHR | 0.005 | 0.058 | 0.231 | 0.000 | 0.000 | 0.000 | 0.707 | 0.000 | ||
| 18 spectra, INAADYAR | 0.057 | 0.000 | 0.027 | 0.000 | 0.000 | 0.000 | 0.911 | 0.005 | ||
| 12 spectra, AVAIDLPGLGR | 0.000 | 0.000 | 0.000 | 0.000 | 0.000 | 0.000 | 1.000 | 0.000 | ||
| 24 spectra, GQSLFFR | 0.000 | 0.000 | 0.000 | 0.000 | 0.000 | 0.000 | 0.981 | 0.019 | ||
| 3 spectra, EARPGNGQAVR | 0.007 | 0.000 | 0.108 | 0.000 | 0.000 | 0.000 | 0.836 | 0.049 | ||
| 12 spectra, FSSETWQNLGTLHR | 0.066 | 0.021 | 0.059 | 0.000 | 0.000 | 0.000 | 0.854 | 0.000 | ||
| 2 spectra, GYVPVAPICTDK | 0.000 | 0.000 | 0.000 | 0.000 | 0.000 | 0.000 | 0.931 | 0.069 | ||
| 10 spectra, LAEAGYR | 0.040 | 0.000 | 0.000 | 0.000 | 0.000 | 0.000 | 0.960 | 0.000 | ||
| 3 spectra, ANVELSEGTIQVR | 0.000 | 0.000 | 0.016 | 0.000 | 0.000 | 0.000 | 0.960 | 0.024 |
| Plot | Mito | Lyso or Perox | ER | Golgi | PM | Cytosol | Nucleus | ||||||
| Expt B |
8 peptides |
51 spectra |
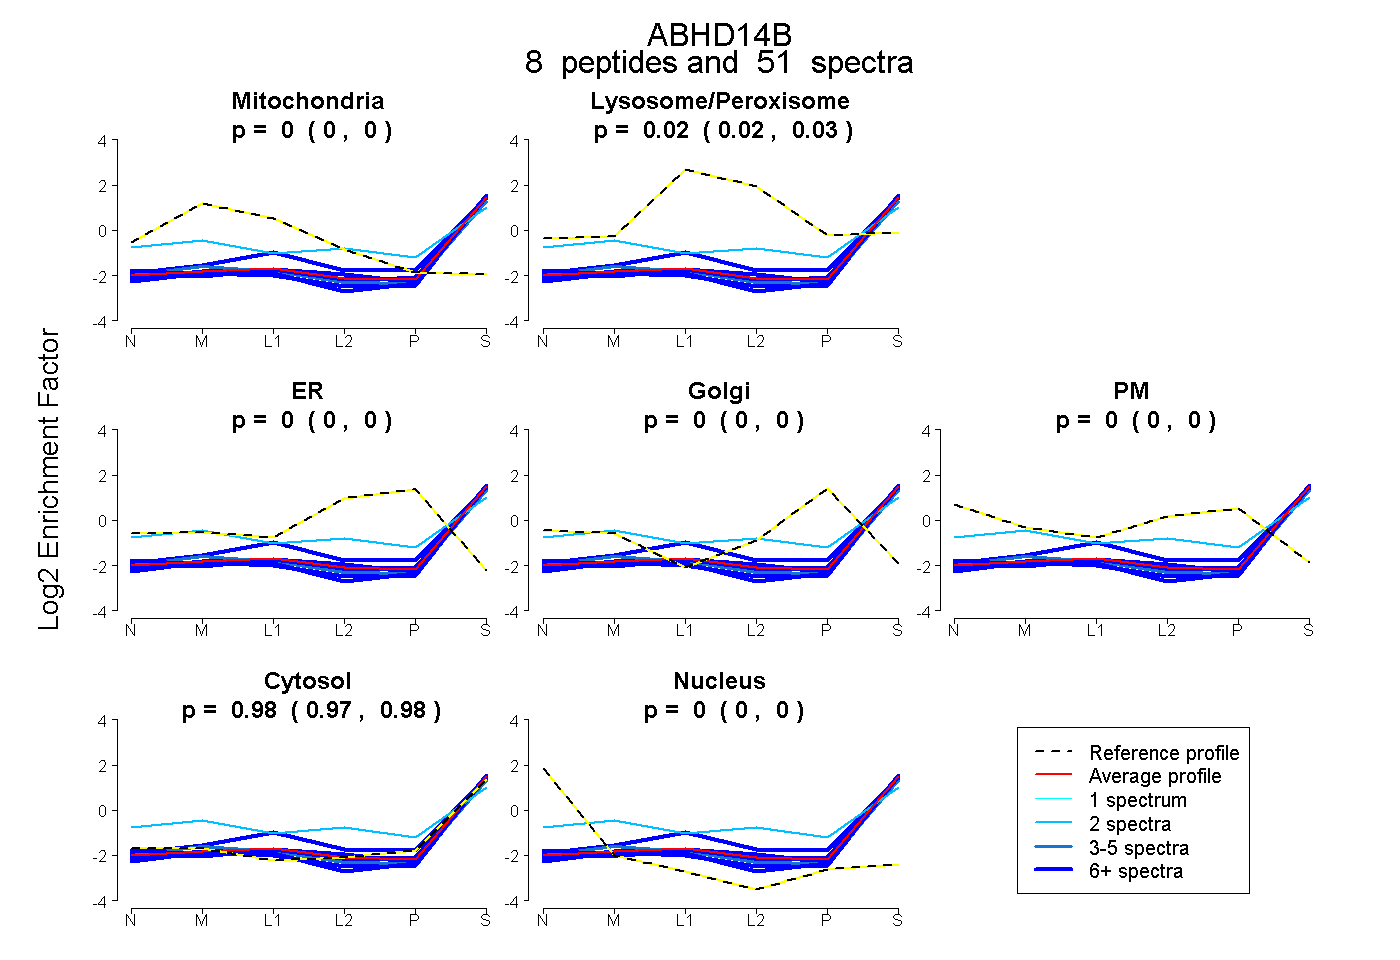 |
0.000 0.000 | 0.000 |
0.023 0.017 | 0.028 |
0.000 0.000 | 0.000 |
0.000 0.000 | 0.000 |
0.000 0.000 | 0.000 |
0.977 0.972 | 0.981 |
0.000 0.000 | 0.000 |
|||
| Plot | Lyso | Other | |||||||||||
| Expt C |
10 peptides |
141 spectra |
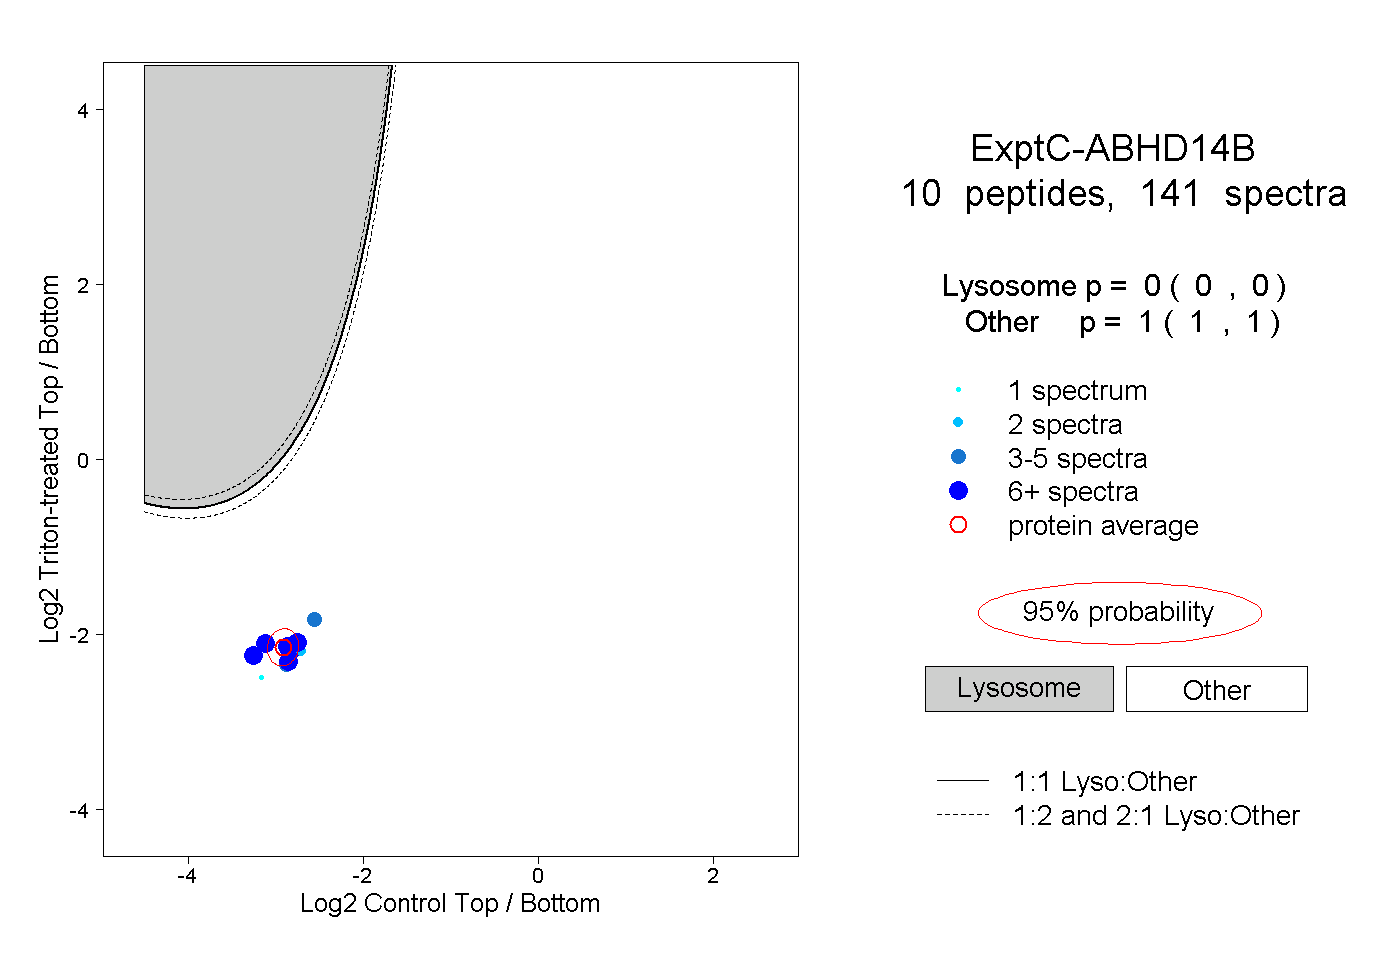 |
0.000 0.000 | 0.000 |
1.000 1.000 | 1.000 |
||||||||
| Plot | Lyso | Other | |||||||||||
| Expt D |
6 peptides |
15 spectra |
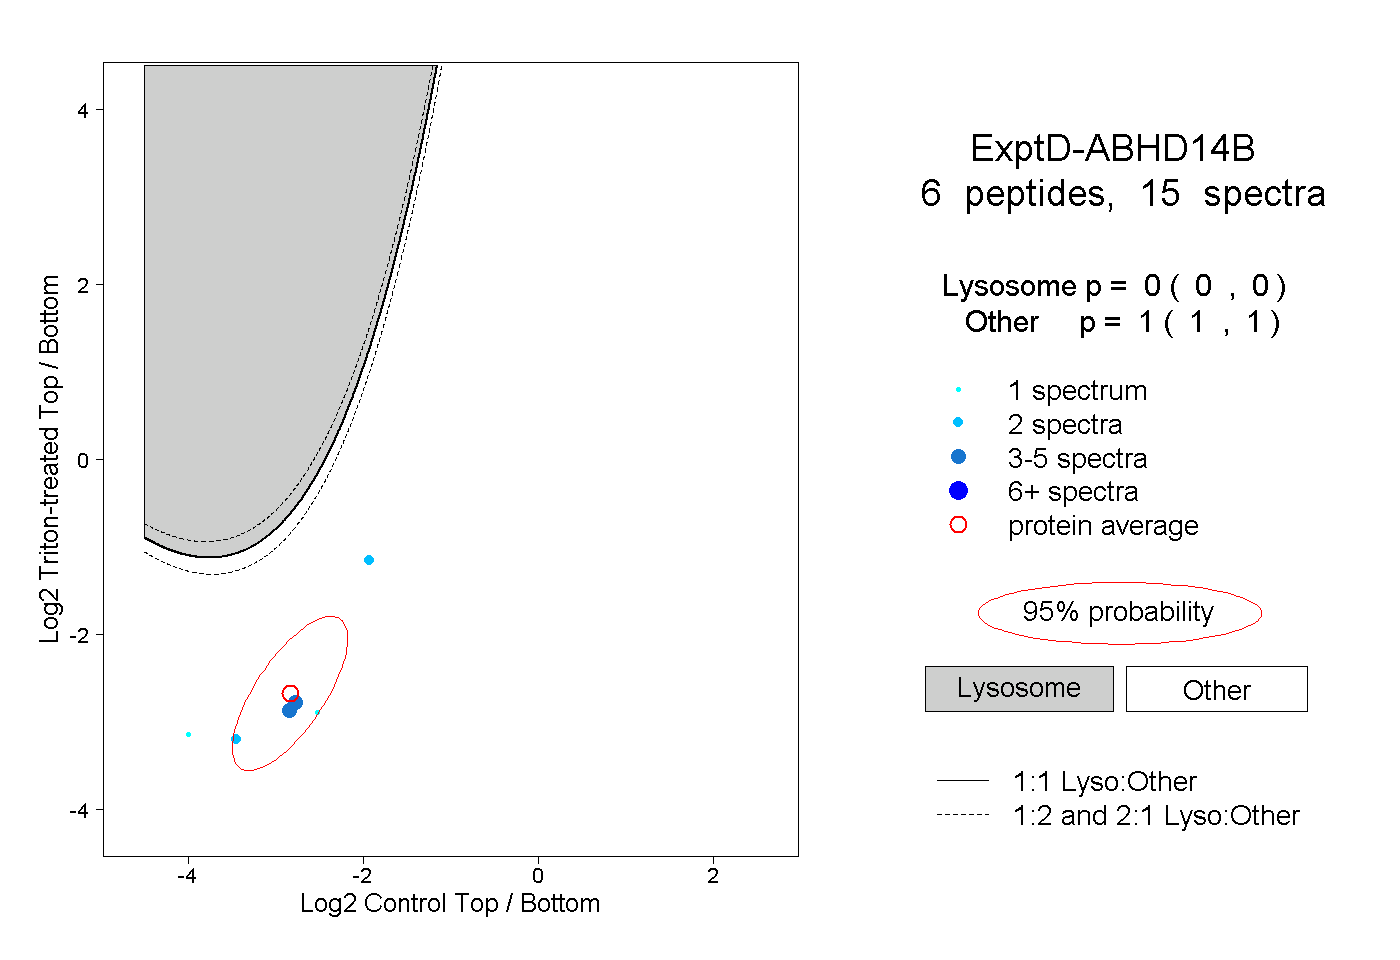 |
0.000 0.000 | 0.000 |
1.000 1.000 | 1.000 |