 19
19peptides
spectra
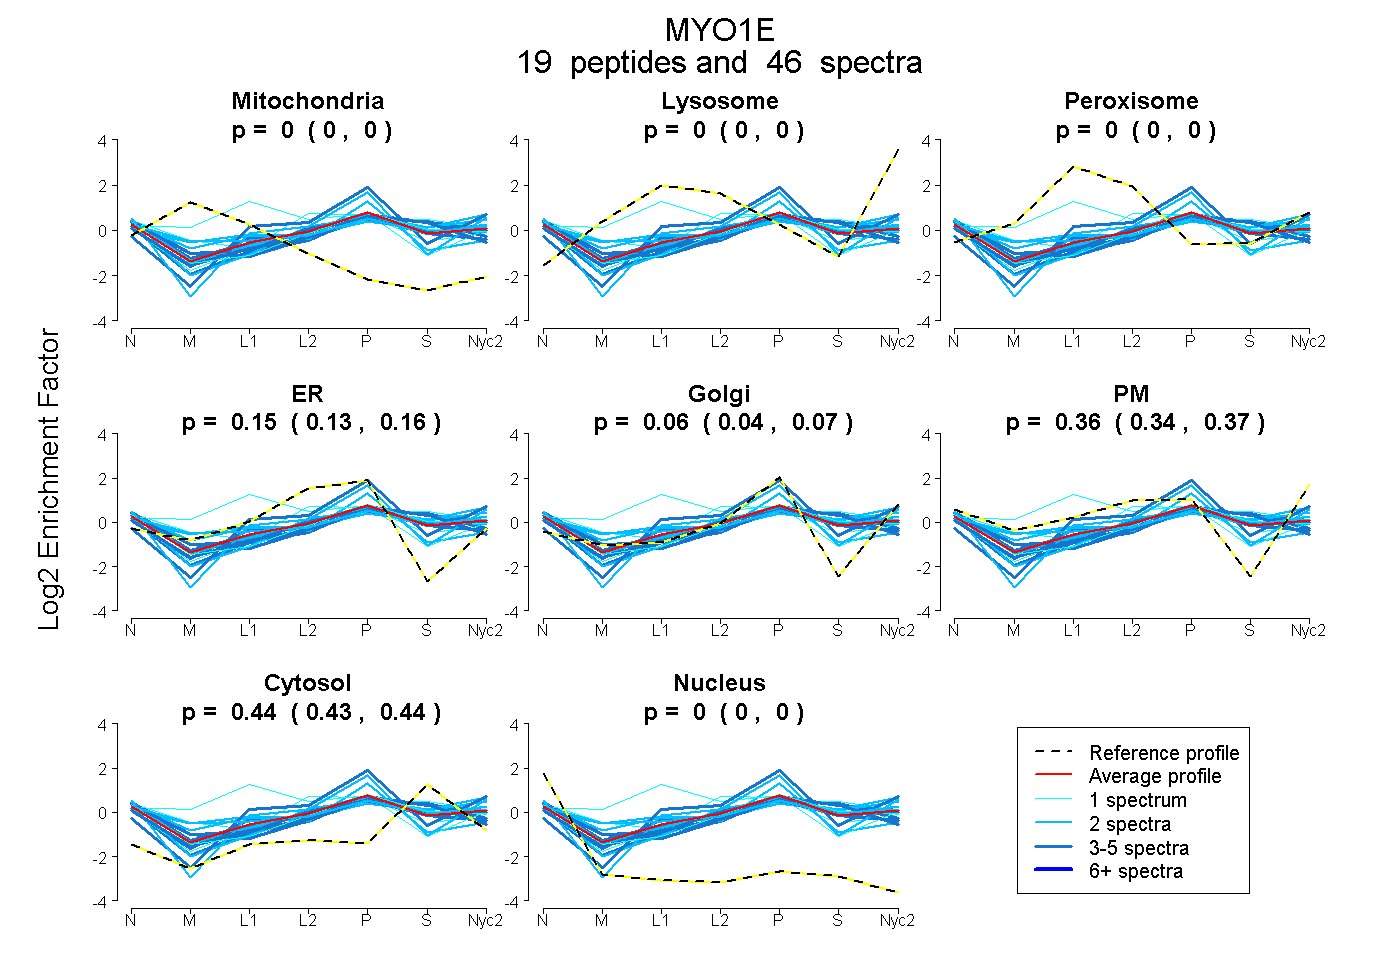
0.000 | 0.000
0.000 | 0.000
0.000 | 0.000
0.135 | 0.157
0.042 | 0.071
0.343 | 0.366
0.434 | 0.444
0.000 | 0.000
7peptides
spectra
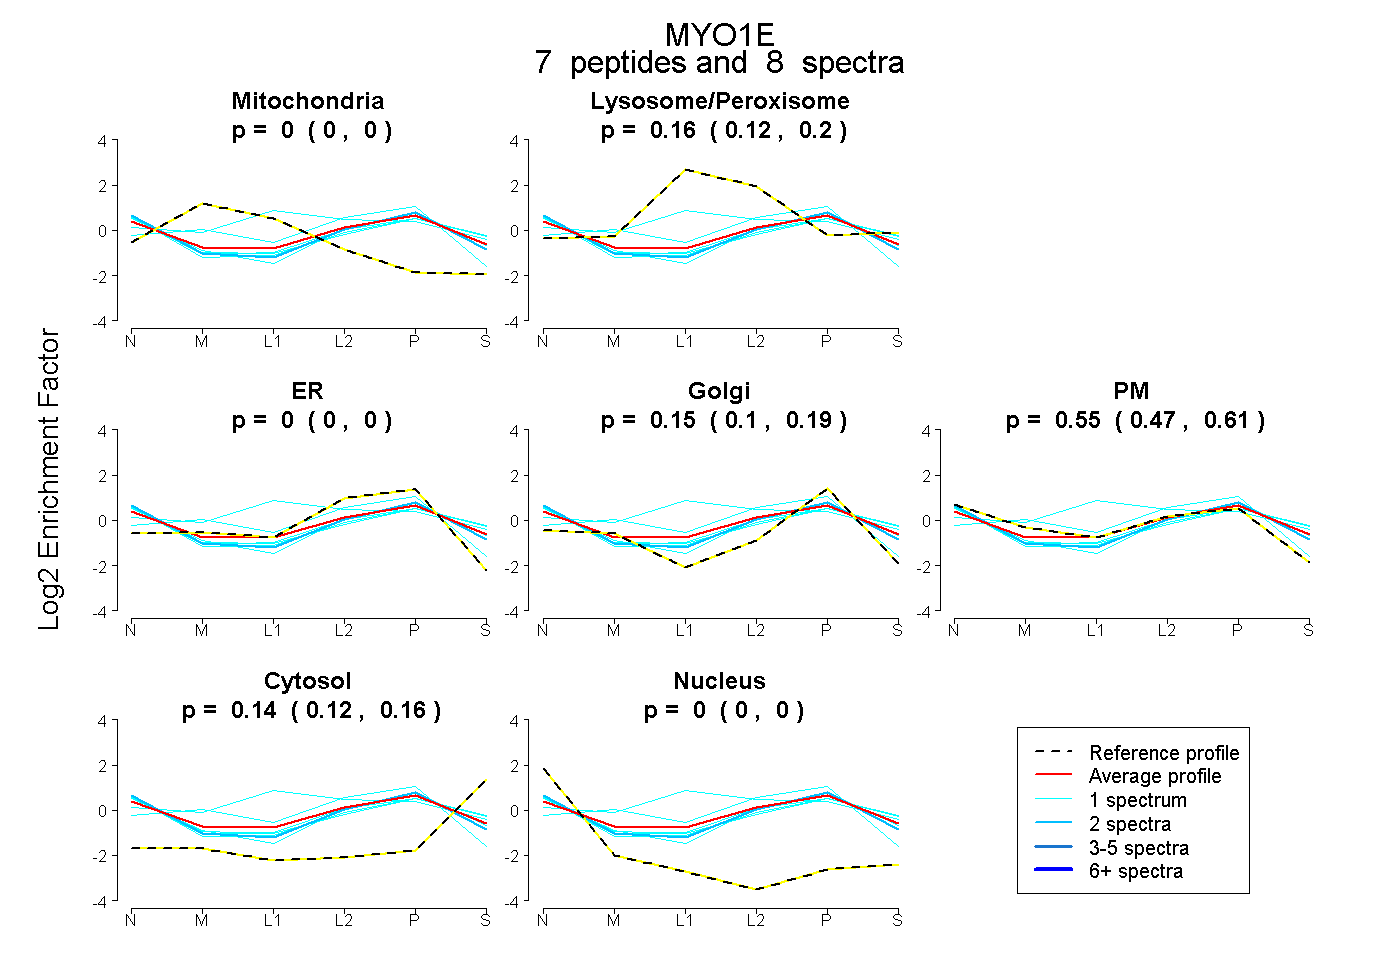
0.000 | 0.000
0.118 | 0.197
0.000 | 0.000
0.100 | 0.194
0.473 | 0.608
0.118 | 0.159
0.000 | 0.000
16peptides
spectra
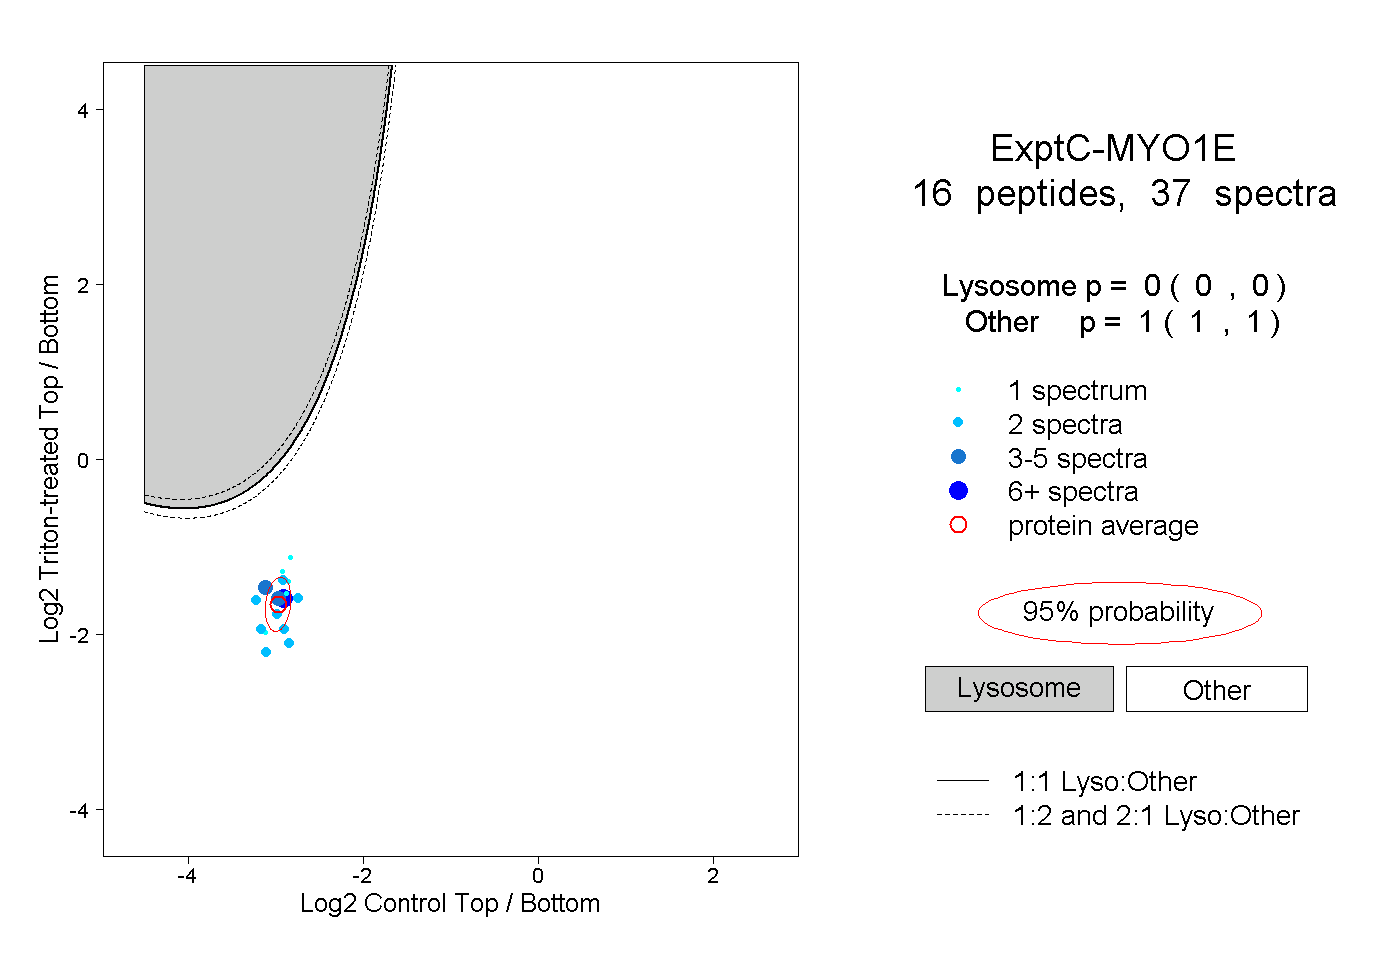
0.000 | 0.000
1.000 | 1.000
2peptides
spectra
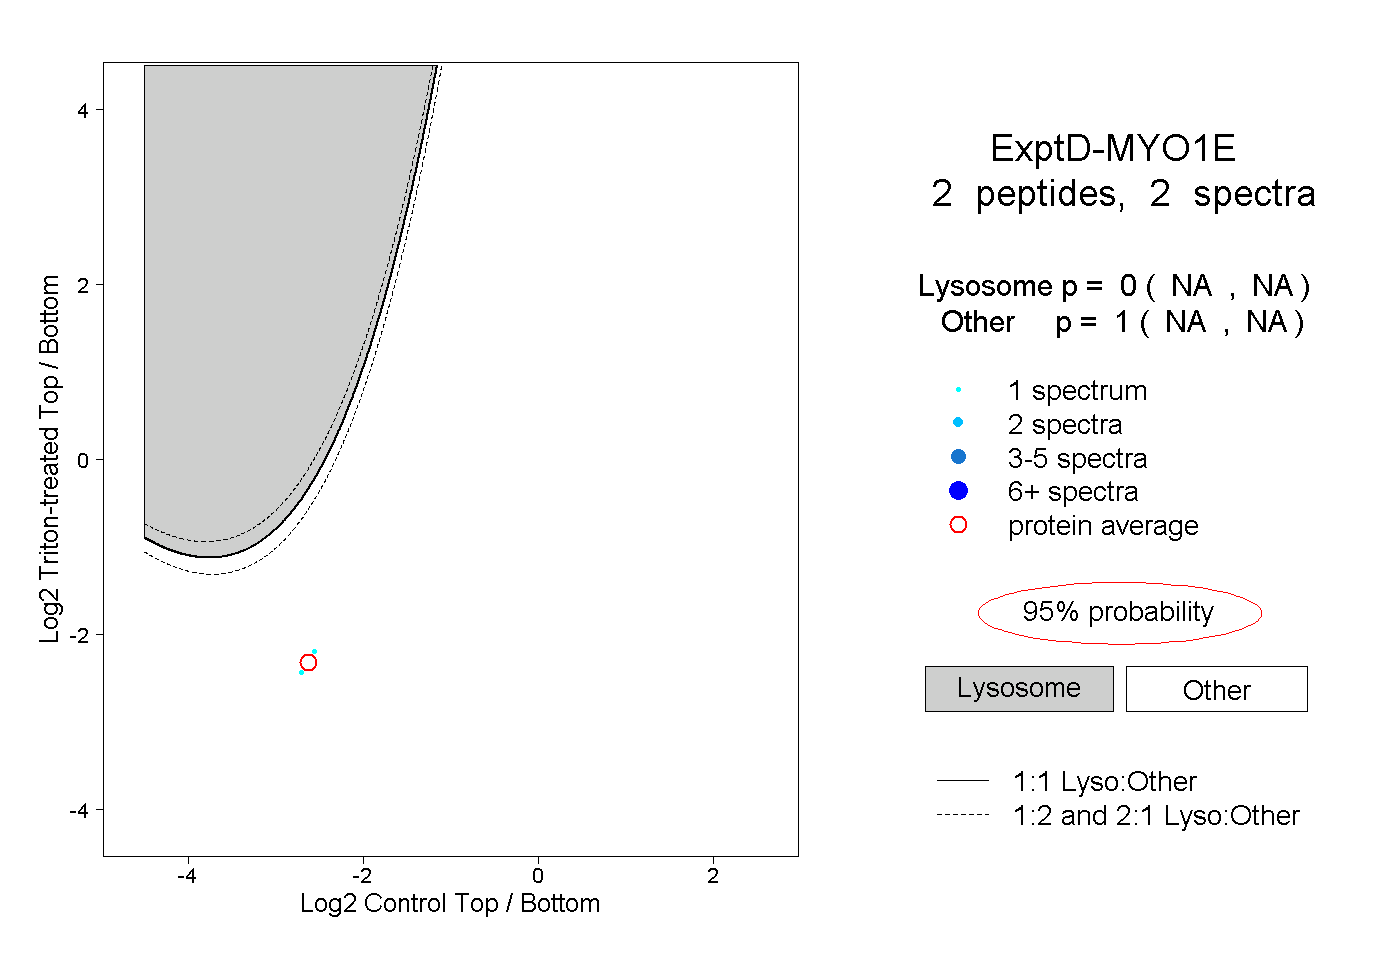
NA | NA
NA | NA