 4
4peptides
spectra
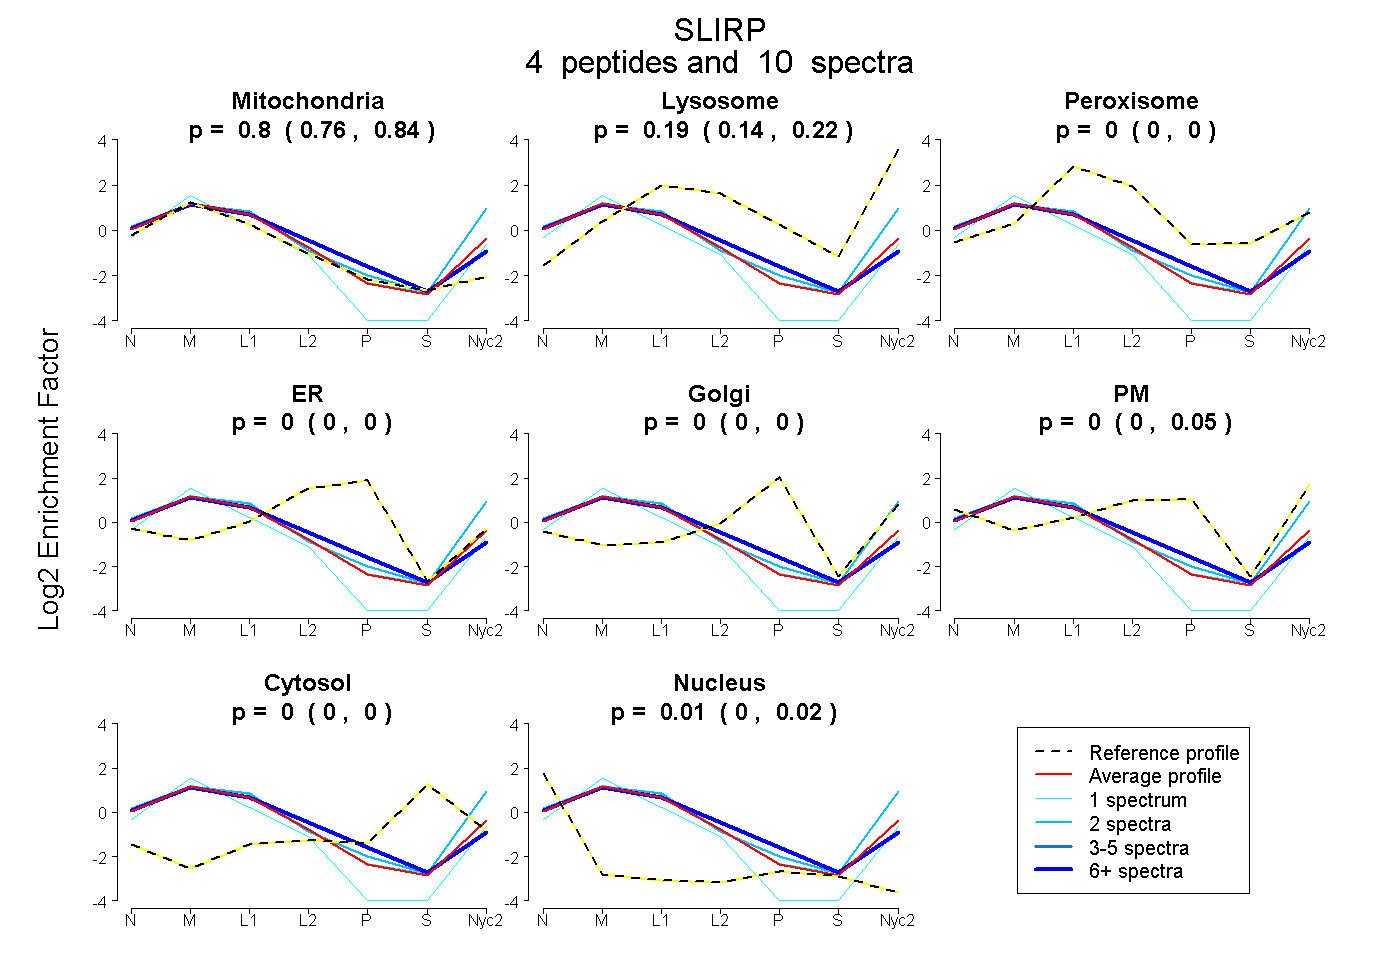
0.757 | 0.838
0.144 | 0.217
0.000 | 0.000
0.000 | 0.000
0.000 | 0.000
0.000 | 0.050
0.000 | 0.000
0.000 | 0.016
3peptides
spectra
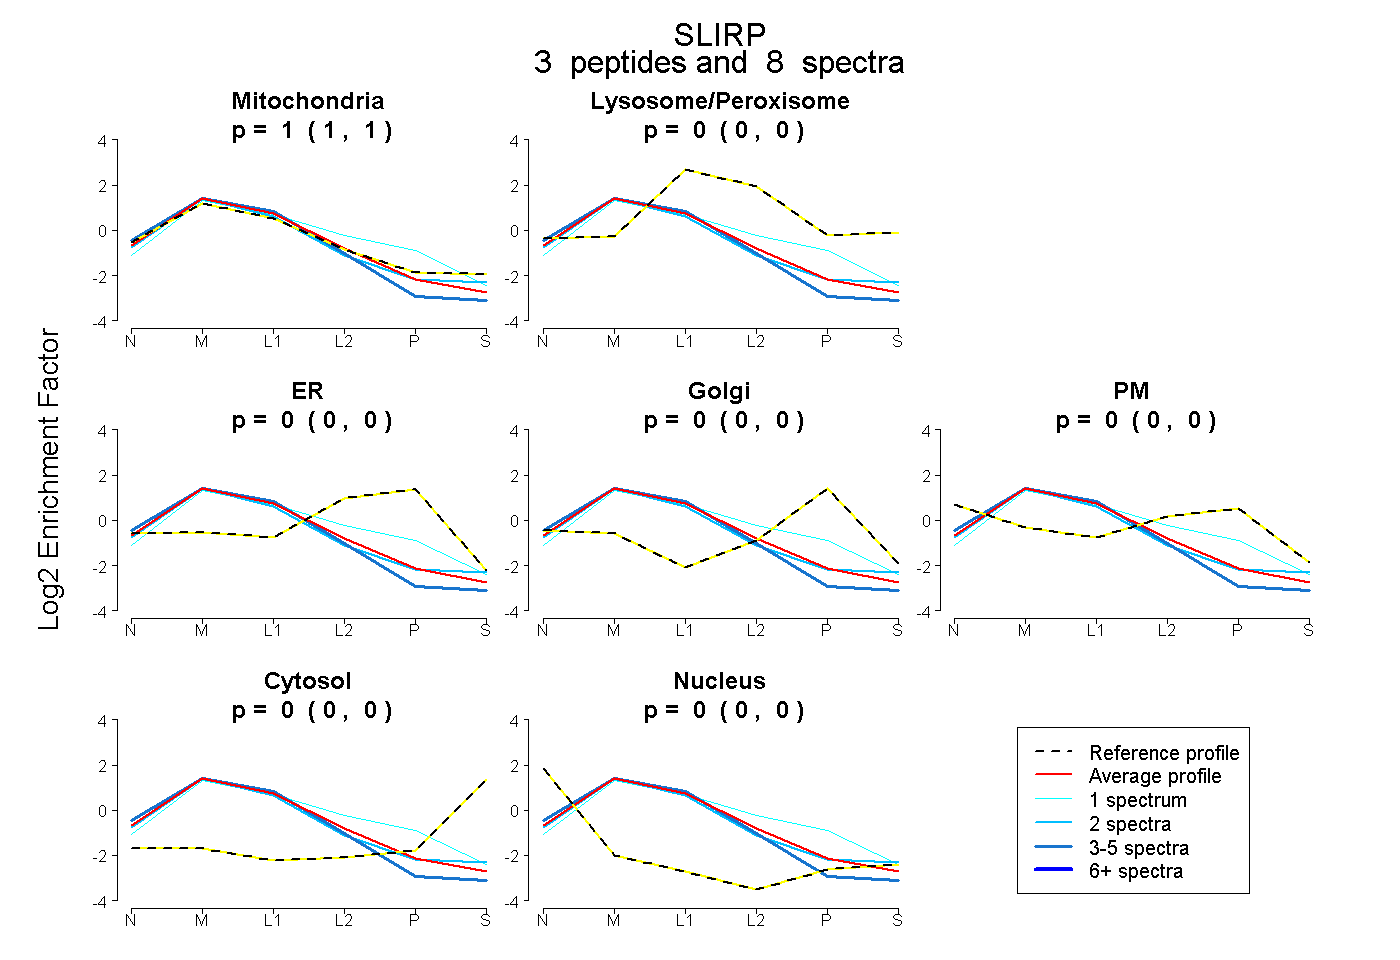
0.995 | 1.000
0.000 | 0.000
0.000 | 0.000
0.000 | 0.000
0.000 | 0.000
0.000 | 0.000
0.000 | 0.000
7peptides
spectra
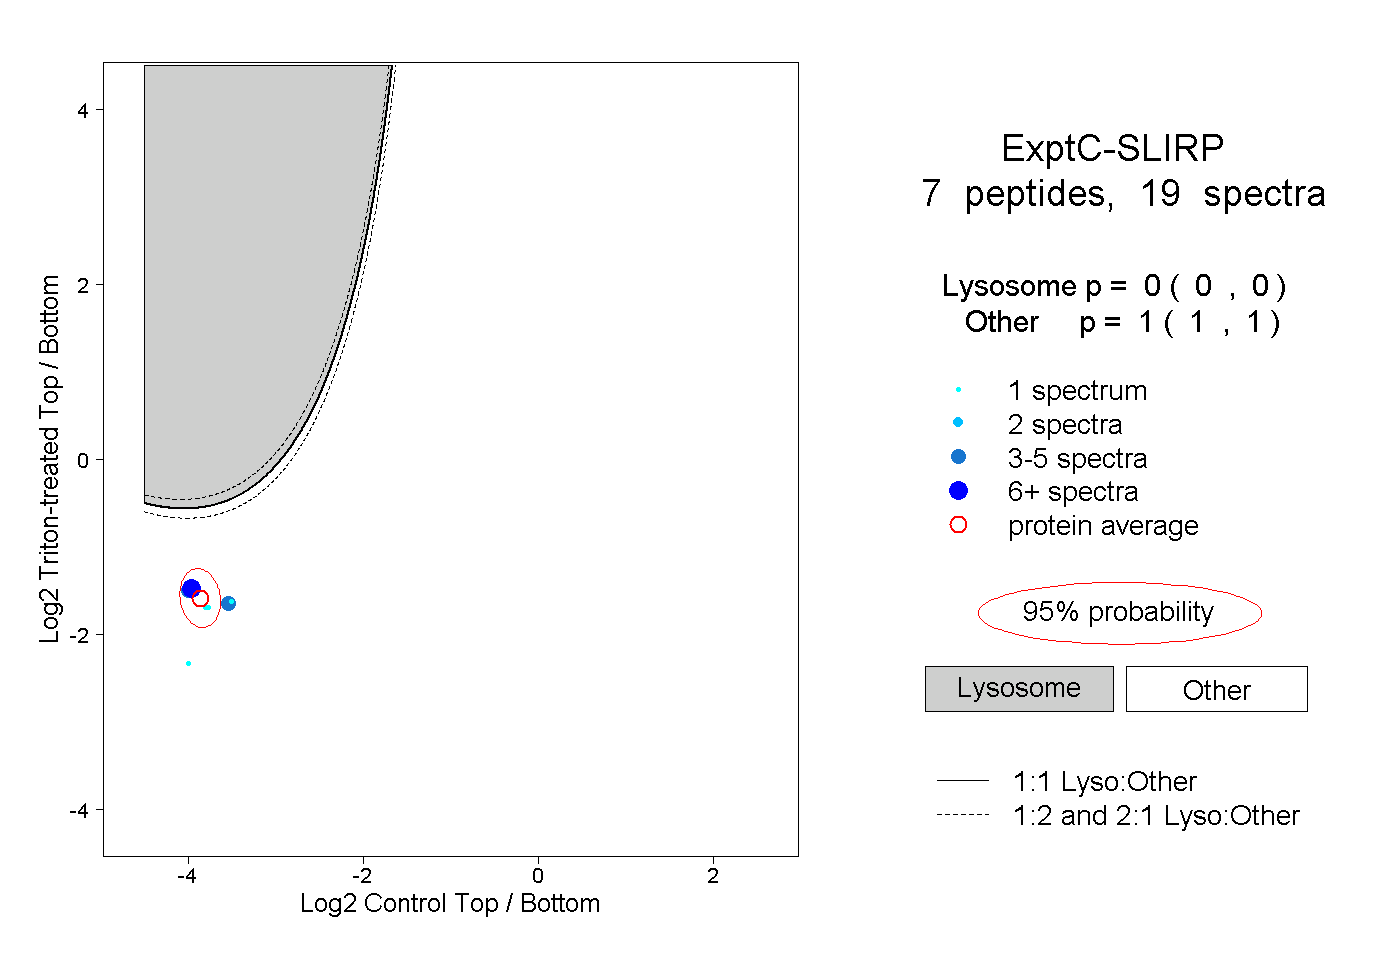
0.000 | 0.000
1.000 | 1.000
2peptides
spectra
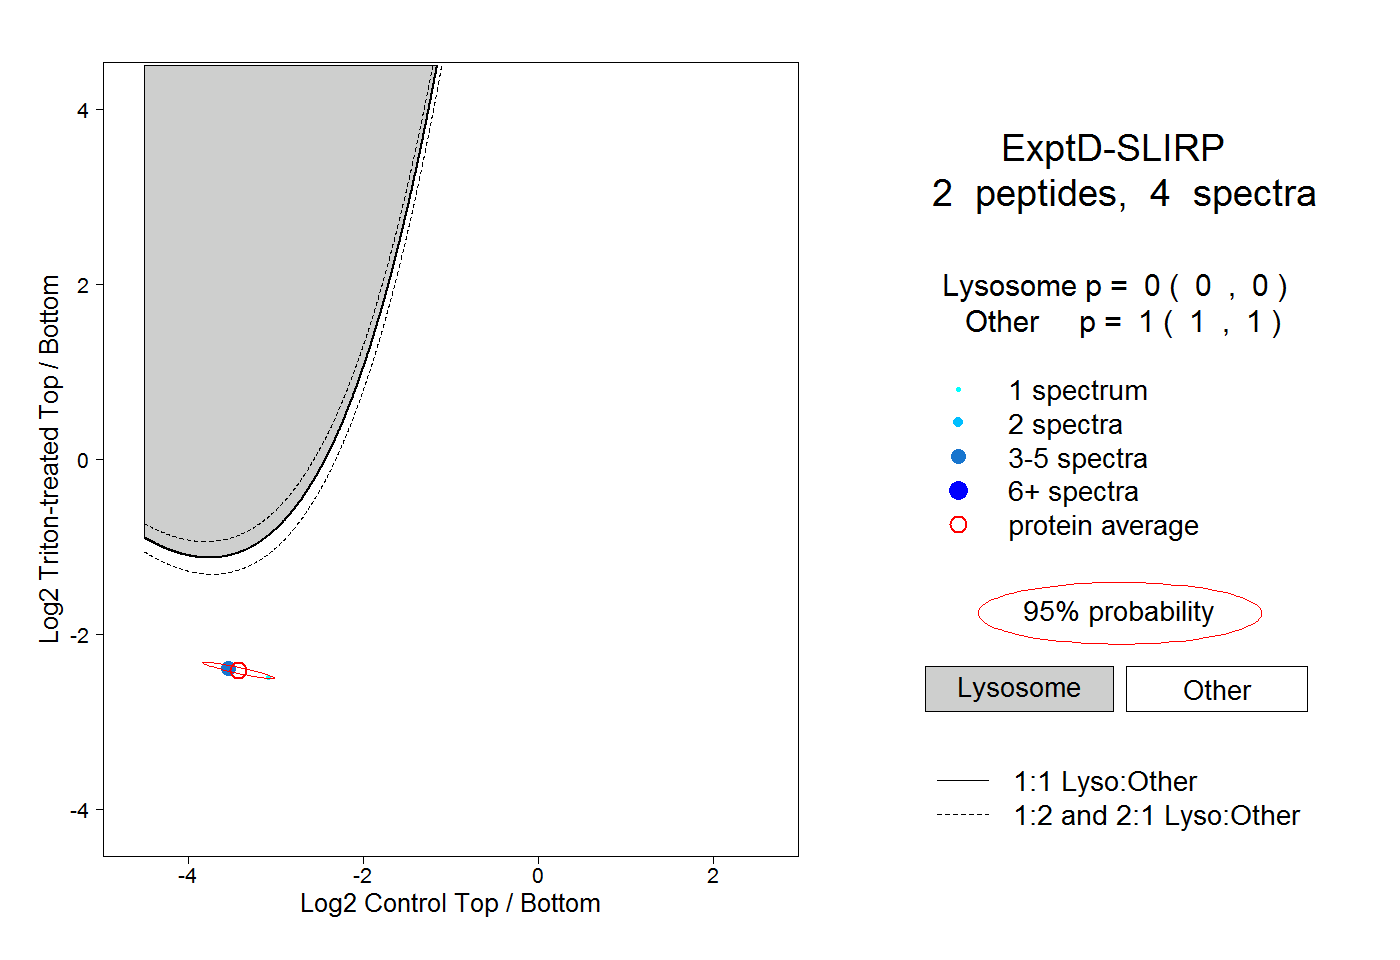
0.000 | 0.000
1.000 | 1.000