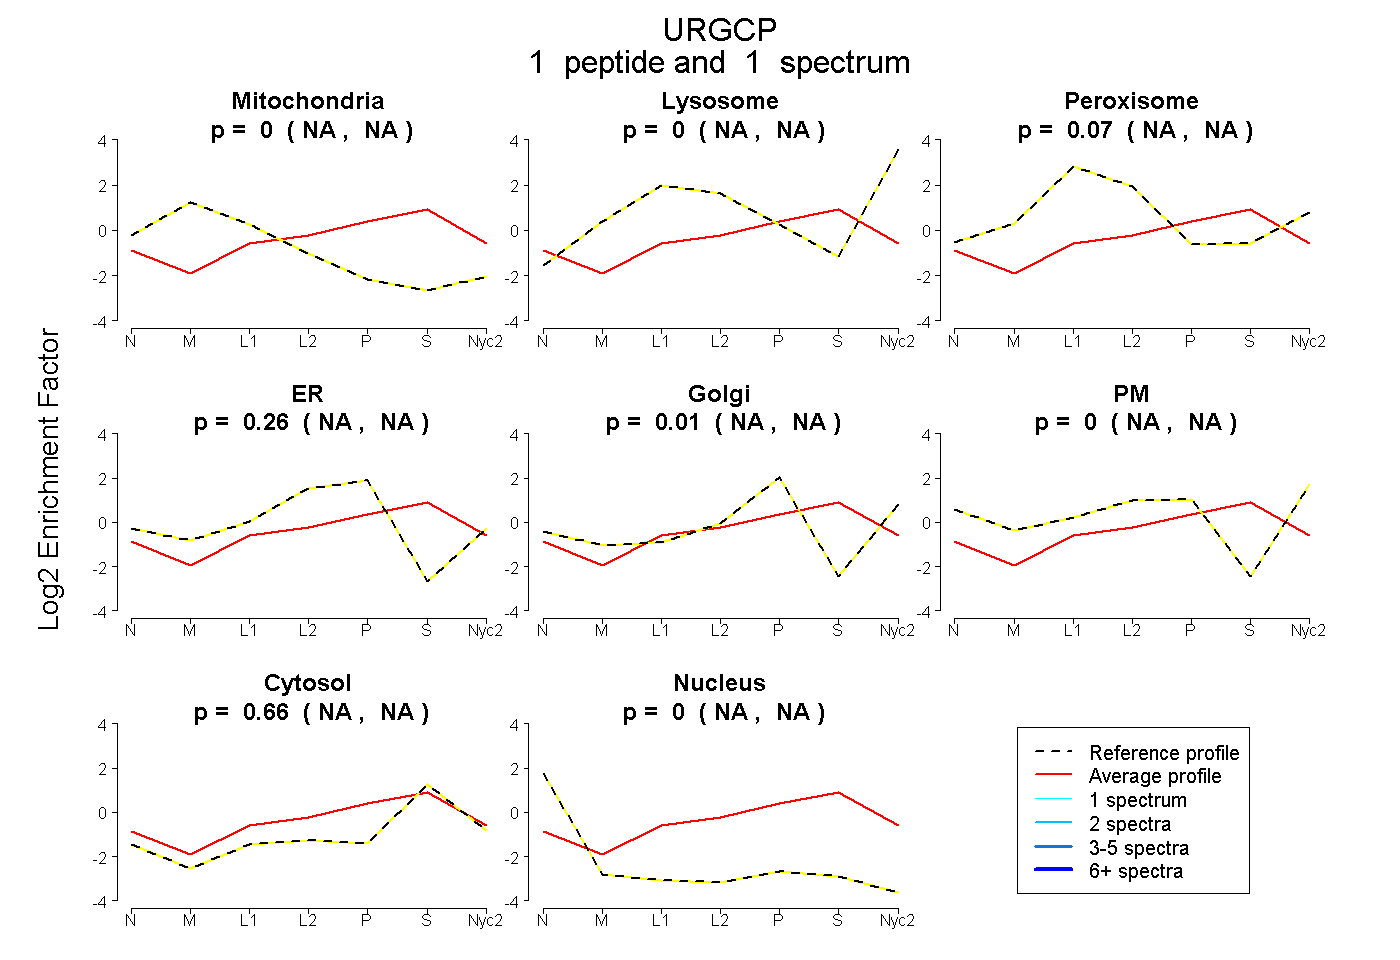
 1
1peptide
spectrum
NA | NA
NA | NA
NA | NA
NA | NA
NA | NA
NA | NA
NA | NA
NA | NA
| Plot | Mito | Lyso | Perox | ER | Golgi | PM | Cytosol | Nucleus | |||||
| Expt A |
1 peptide |
1 spectrum |
|
0.000 NA | NA |
0.000 NA | NA |
0.072 NA | NA |
0.263 NA | NA |
0.007 NA | NA |
0.000 NA | NA |
0.658 NA | NA |
0.000 NA | NA |
| 1 spectrum, DIPPAVLHAFLR | 0.000 | 0.000 | 0.072 | 0.263 | 0.007 | 0.000 | 0.658 | 0.000 |
| Plot | Lyso | Other | |||||||||||
| Expt C |
3 peptides |
4 spectra |
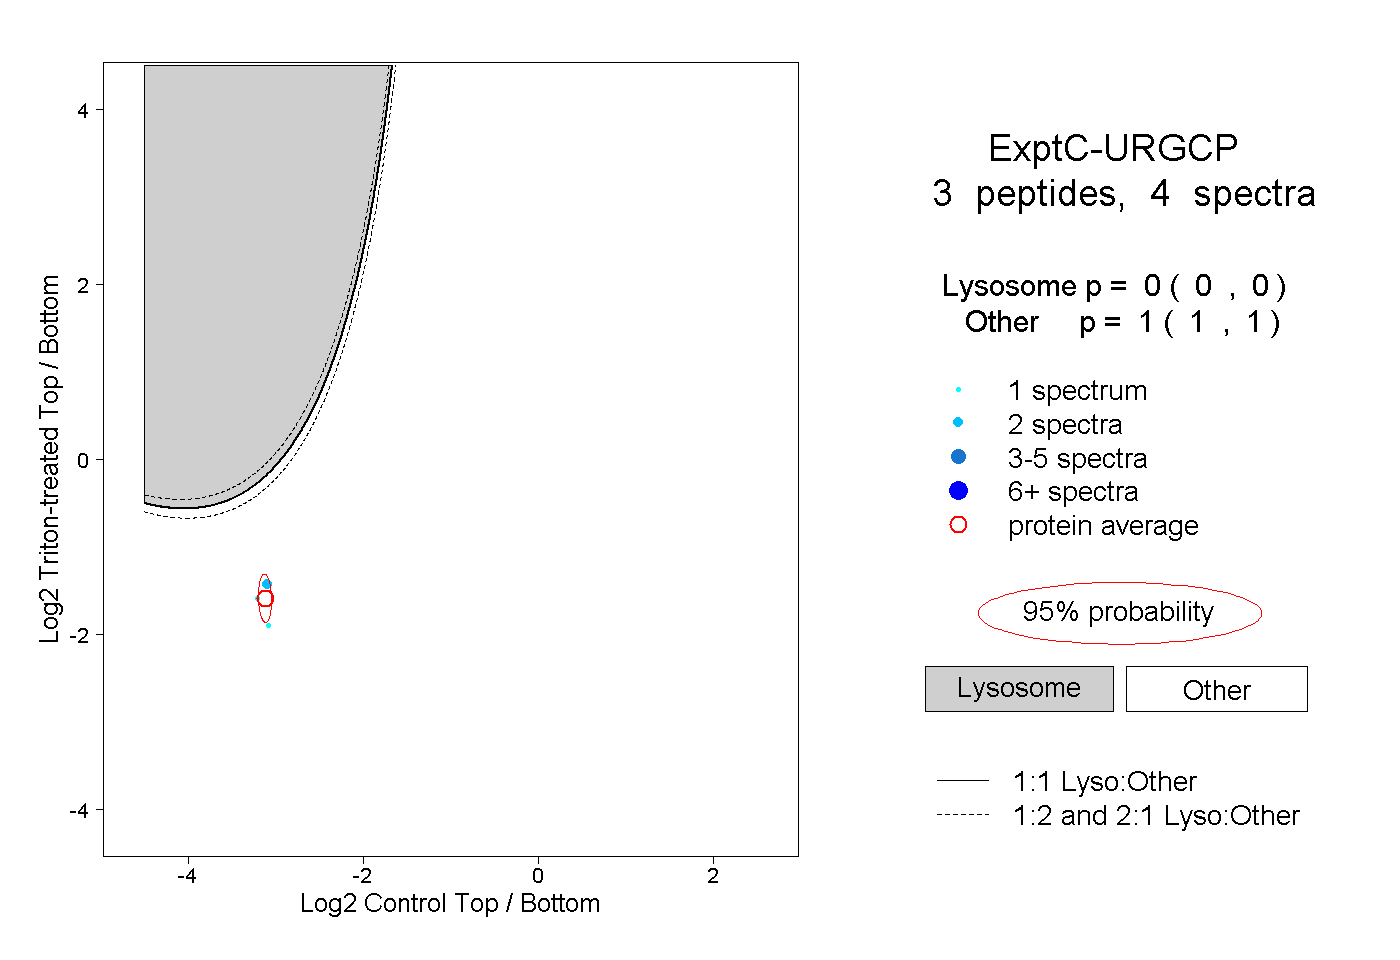 |
0.000 0.000 | 0.000 |
1.000 1.000 | 1.000 |