 3
3peptides
spectra
0.000 | 0.000
0.000 | 0.000
0.000 | 0.000
0.000 | 0.139
0.000 | 0.348
0.335 | 0.709
0.037 | 0.241
0.024 | 0.172
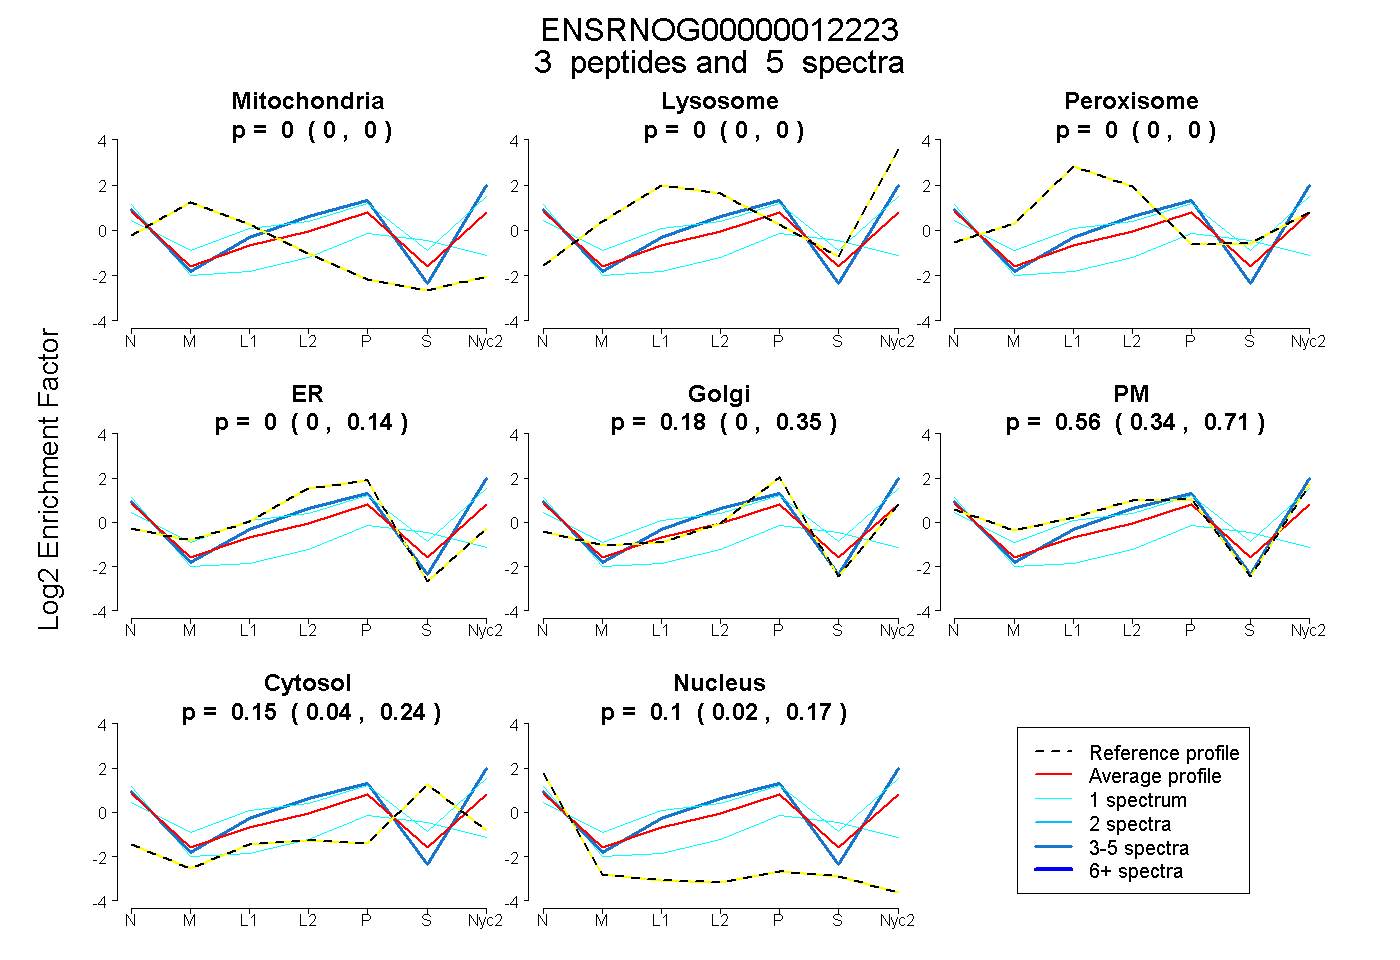
| Plot | Mito | Lyso | Perox | ER | Golgi | PM | Cytosol | Nucleus | |||||
| Expt A |
3 peptides |
5 spectra |
|
0.000 0.000 | 0.000 |
0.000 0.000 | 0.000 |
0.000 0.000 | 0.000 |
0.000 0.000 | 0.139 |
0.180 0.000 | 0.348 |
0.563 0.335 | 0.709 |
0.154 0.037 | 0.241 |
0.104 0.024 | 0.172 |
| 3 spectra, LLKPQR | 0.000 | 0.000 | 0.000 | 0.000 | 0.228 | 0.735 | 0.009 | 0.028 | ||
| 1 spectrum, ESVAPTEHLK | 0.000 | 0.000 | 0.000 | 0.000 | 0.159 | 0.179 | 0.356 | 0.305 | ||
| 1 spectrum, LVLDK | 0.000 | 0.072 | 0.000 | 0.000 | 0.056 | 0.675 | 0.198 | 0.000 |
| Plot | Mito | Lyso or Perox | ER | Golgi | PM | Cytosol | Nucleus | ||||||
| Expt B |
1 peptide |
2 spectra |
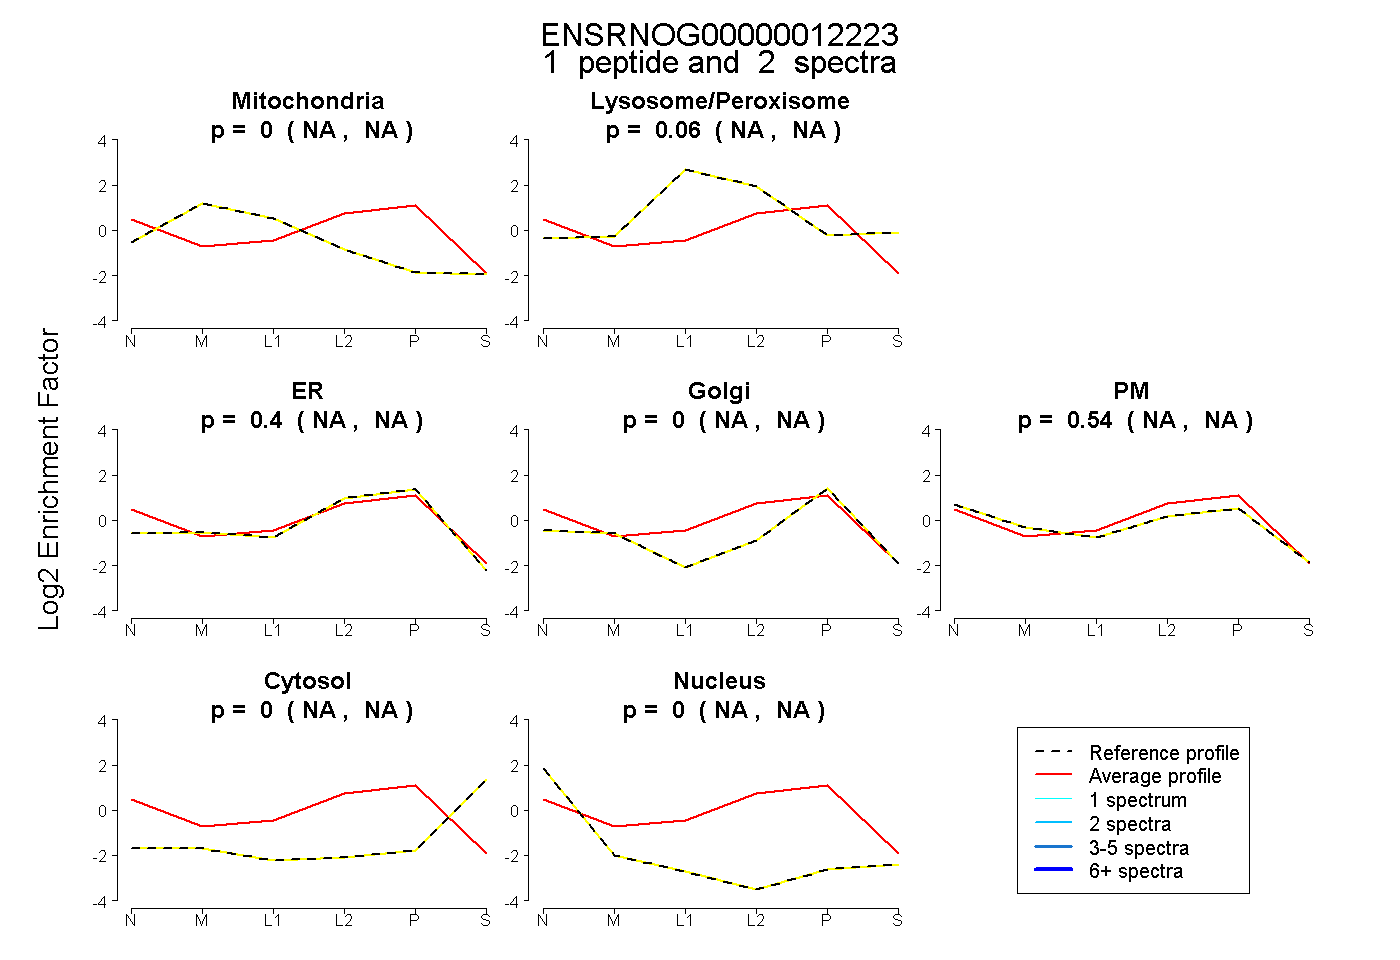 |
0.000 NA | NA |
0.063 NA | NA |
0.399 NA | NA |
0.000 NA | NA |
0.538 NA | NA |
0.000 NA | NA |
0.000 NA | NA |
|||
| Plot | Lyso | Other | |||||||||||
| Expt C |
3 peptides |
5 spectra |
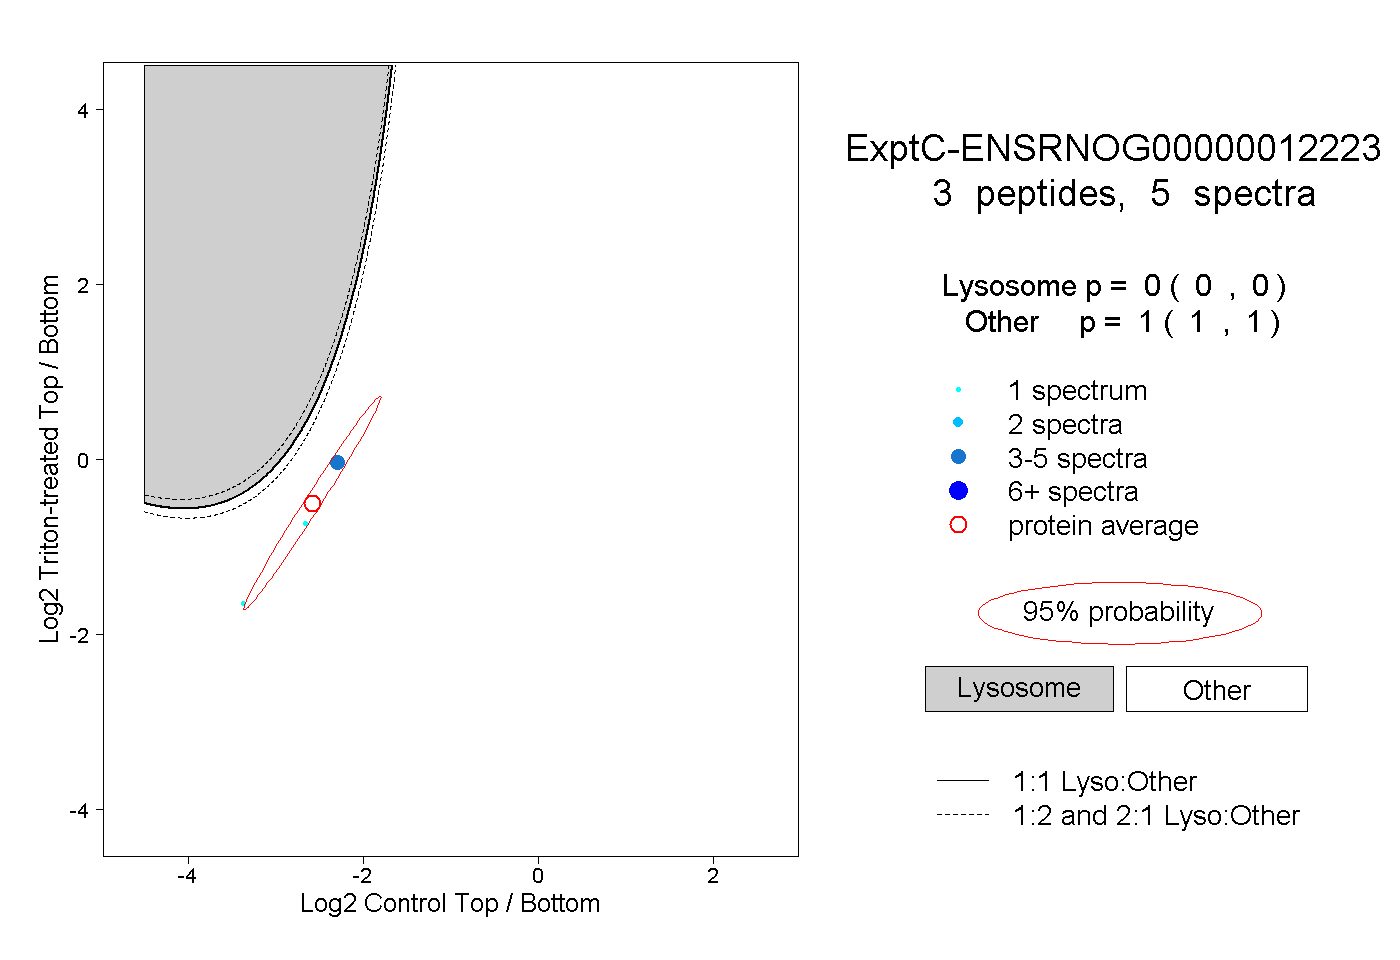 |
0.000 0.000 | 0.000 |
1.000 1.000 | 1.000 |
||||||||
| Plot | Lyso | Other | |||||||||||
| Expt D |
2 peptides |
3 spectra |
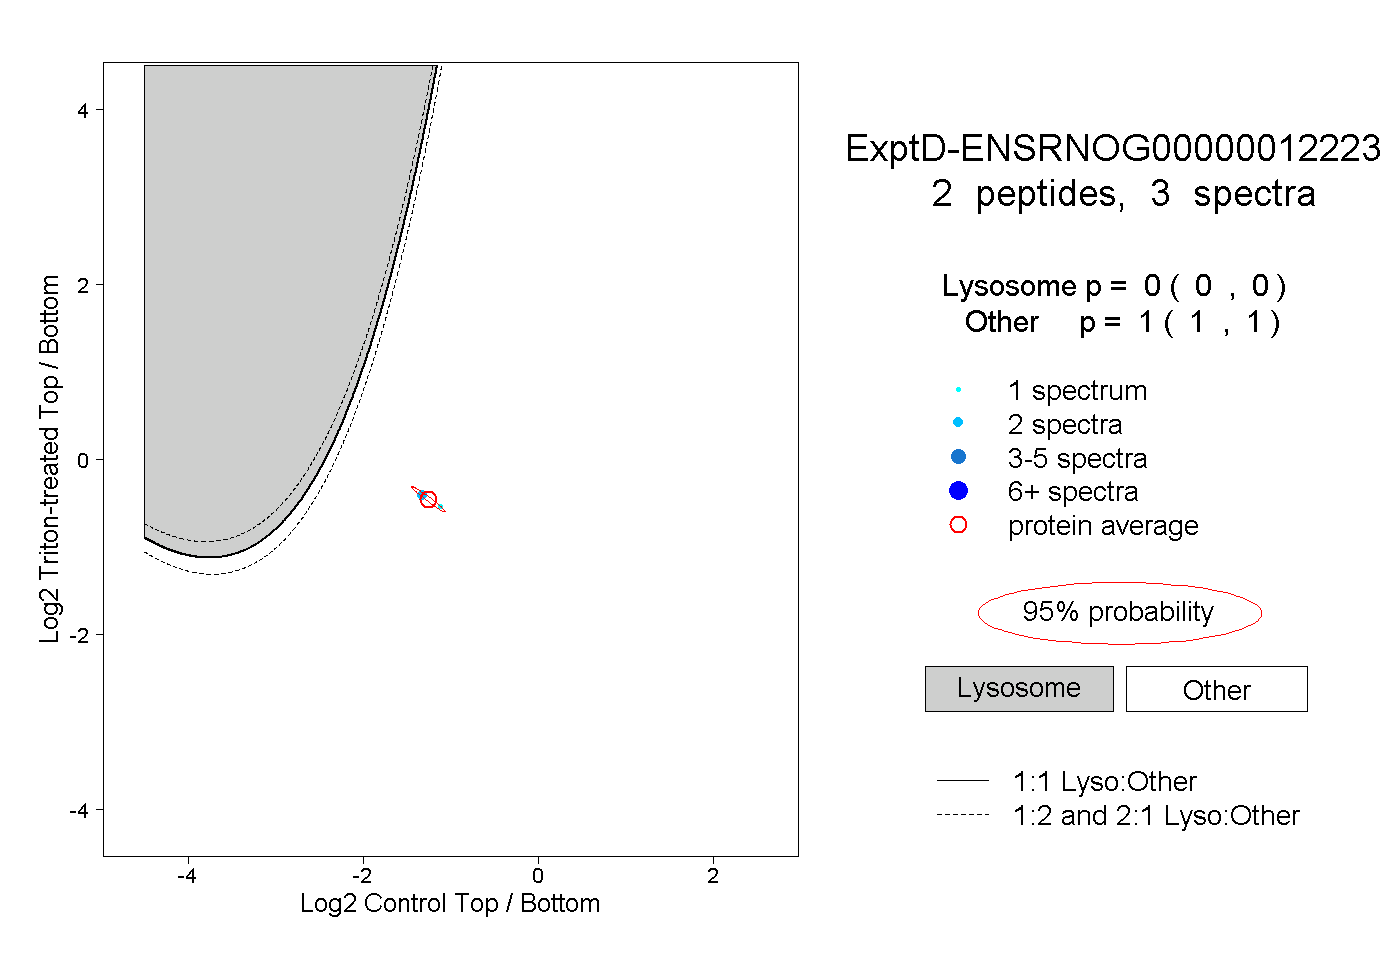 |
0.000 0.000 | 0.000 |
1.000 1.000 | 1.000 |