 6
6peptides
spectra
0.839 | 0.924
0.000 | 0.000
0.003 | 0.109
0.000 | 0.101
0.000 | 0.000
0.000 | 0.020
0.000 | 0.000
0.000 | 0.023
8peptides
spectra
0.000 | 0.000
1.000 | 1.000
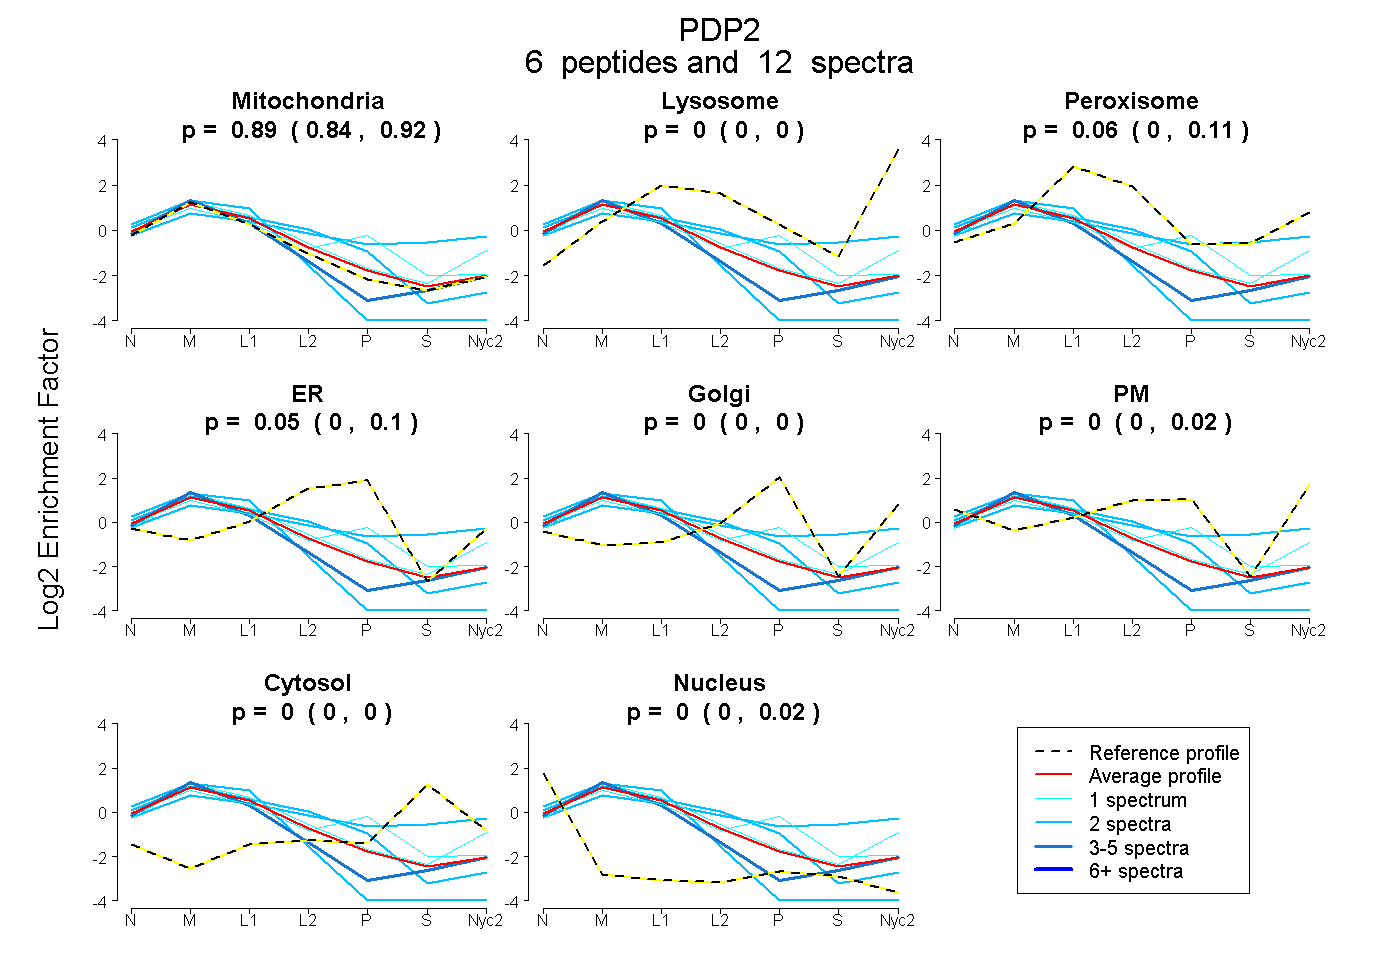
| Plot | Mito | Lyso | Perox | ER | Golgi | PM | Cytosol | Nucleus | |||||
| Expt A |
6 peptides |
12 spectra |
|
0.892 0.839 | 0.924 |
0.000 0.000 | 0.000 |
0.057 0.003 | 0.109 |
0.049 0.000 | 0.101 |
0.000 0.000 | 0.000 |
0.000 0.000 | 0.020 |
0.000 0.000 | 0.000 |
0.002 0.000 | 0.023 |
||
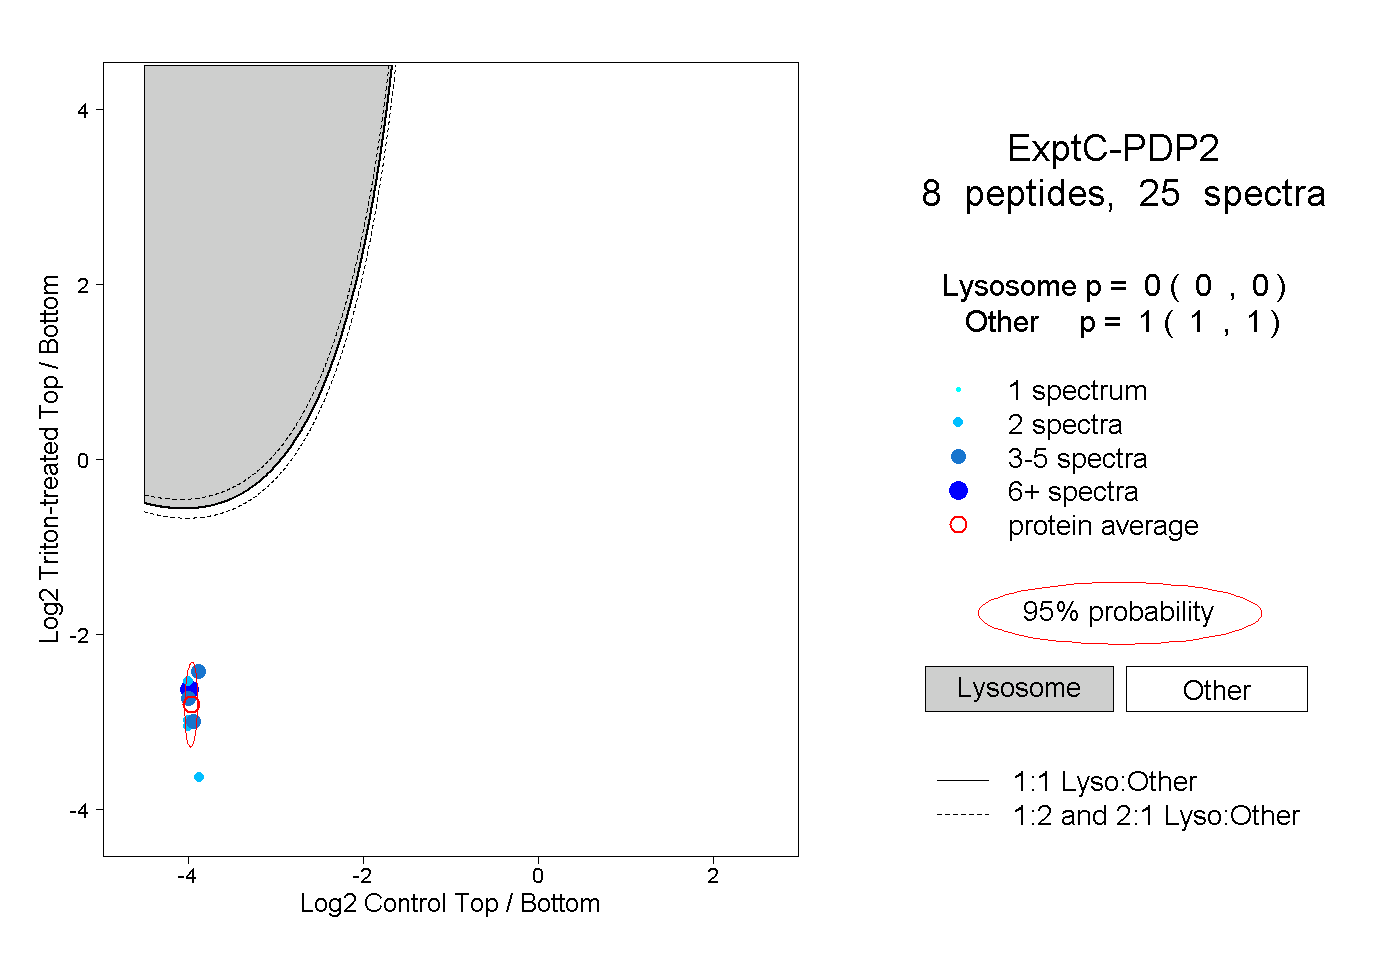
| Plot | Lyso | Other | |||||||||||
| Expt C |
8 peptides |
25 spectra |
|
0.000 0.000 | 0.000 |
1.000 1.000 | 1.000 |
| 3 spectra, AFGDVQLK | 0.000 | 1.000 | ||||||||
| 2 spectra, VLDFNSGVPNSVLR | 0.000 | 1.000 | ||||||||
| 3 spectra, LVVGHLSK | 0.000 | 1.000 | ||||||||
| 5 spectra, TLIIDDR | 0.000 | 1.000 | ||||||||
| 6 spectra, QGVASCVQTR | 0.000 | 1.000 | ||||||||
| 2 spectra, LAAMLTLPEDVAR | 0.000 | 1.000 | ||||||||
| 2 spectra, FESNQLAANSPVEDR | 0.000 | 1.000 | ||||||||
| 2 spectra, LLGVLLPCR | 0.000 | 1.000 |
| Plot | Lyso | Other | |||||||||||
| Expt D |
1 peptide |
1 spectrum |
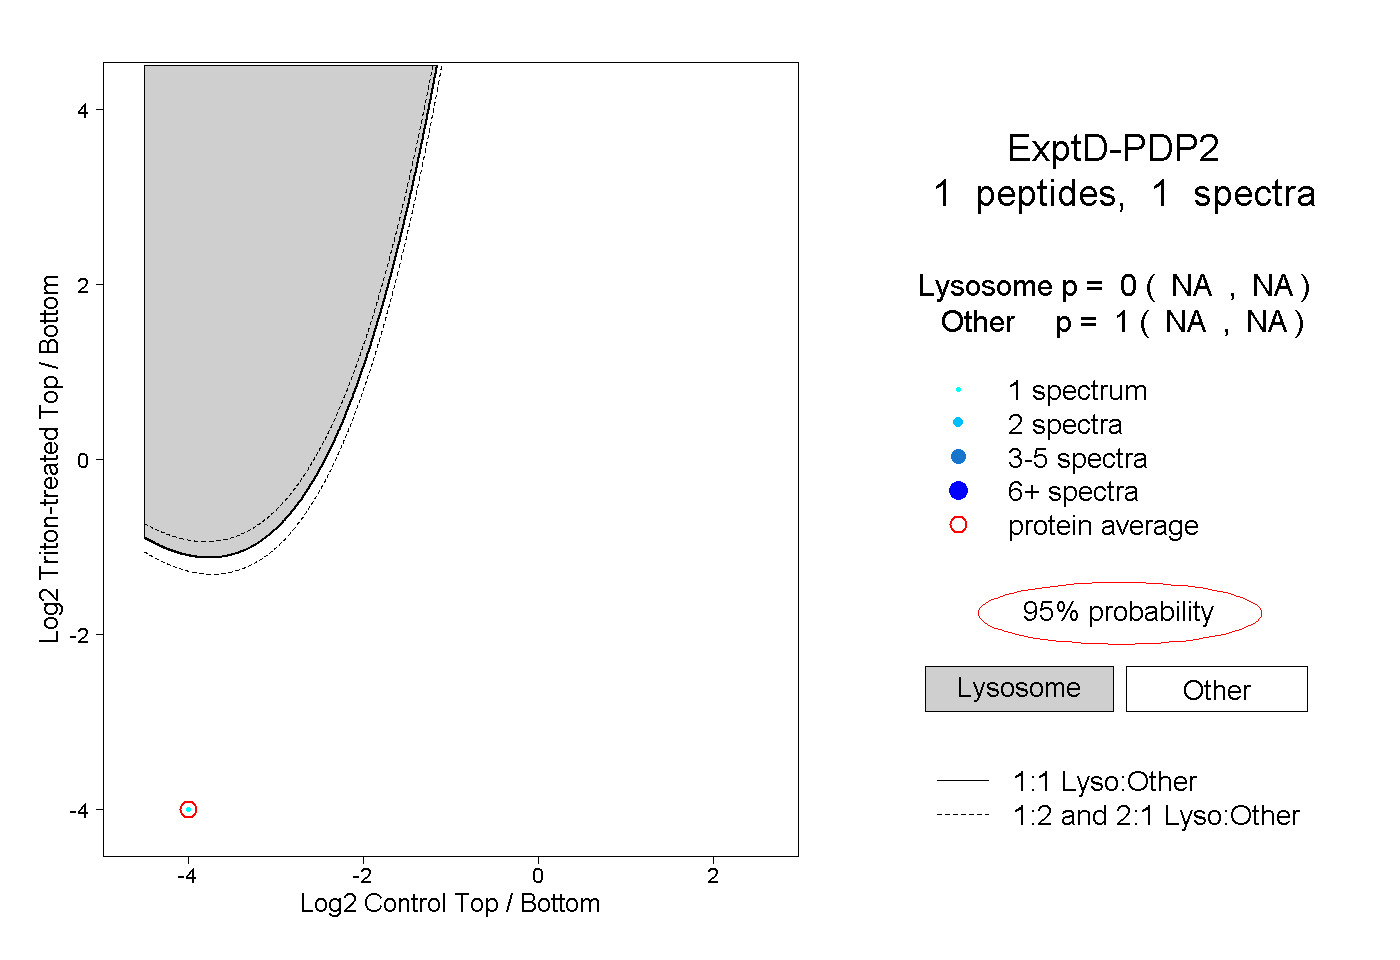 |
0.000 NA | NA |
1.000 NA | NA |