16
16peptides
spectra
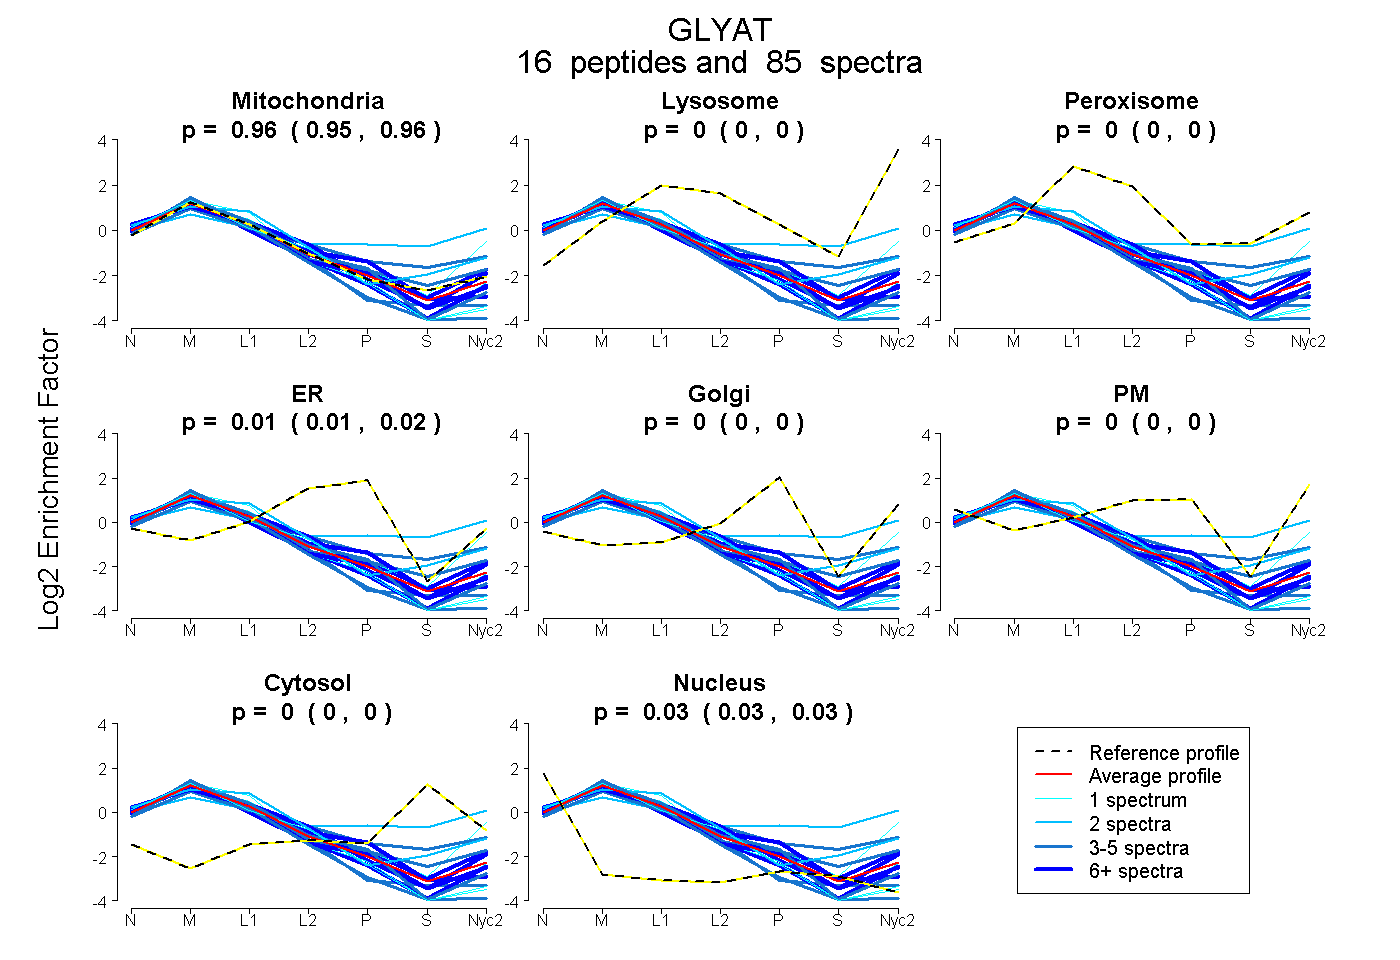
0.951 | 0.959
0.000 | 0.000
0.000 | 0.000
0.010 | 0.019
0.000 | 0.000
0.000 | 0.000
0.000 | 0.000
0.027 | 0.031
12peptides
spectra
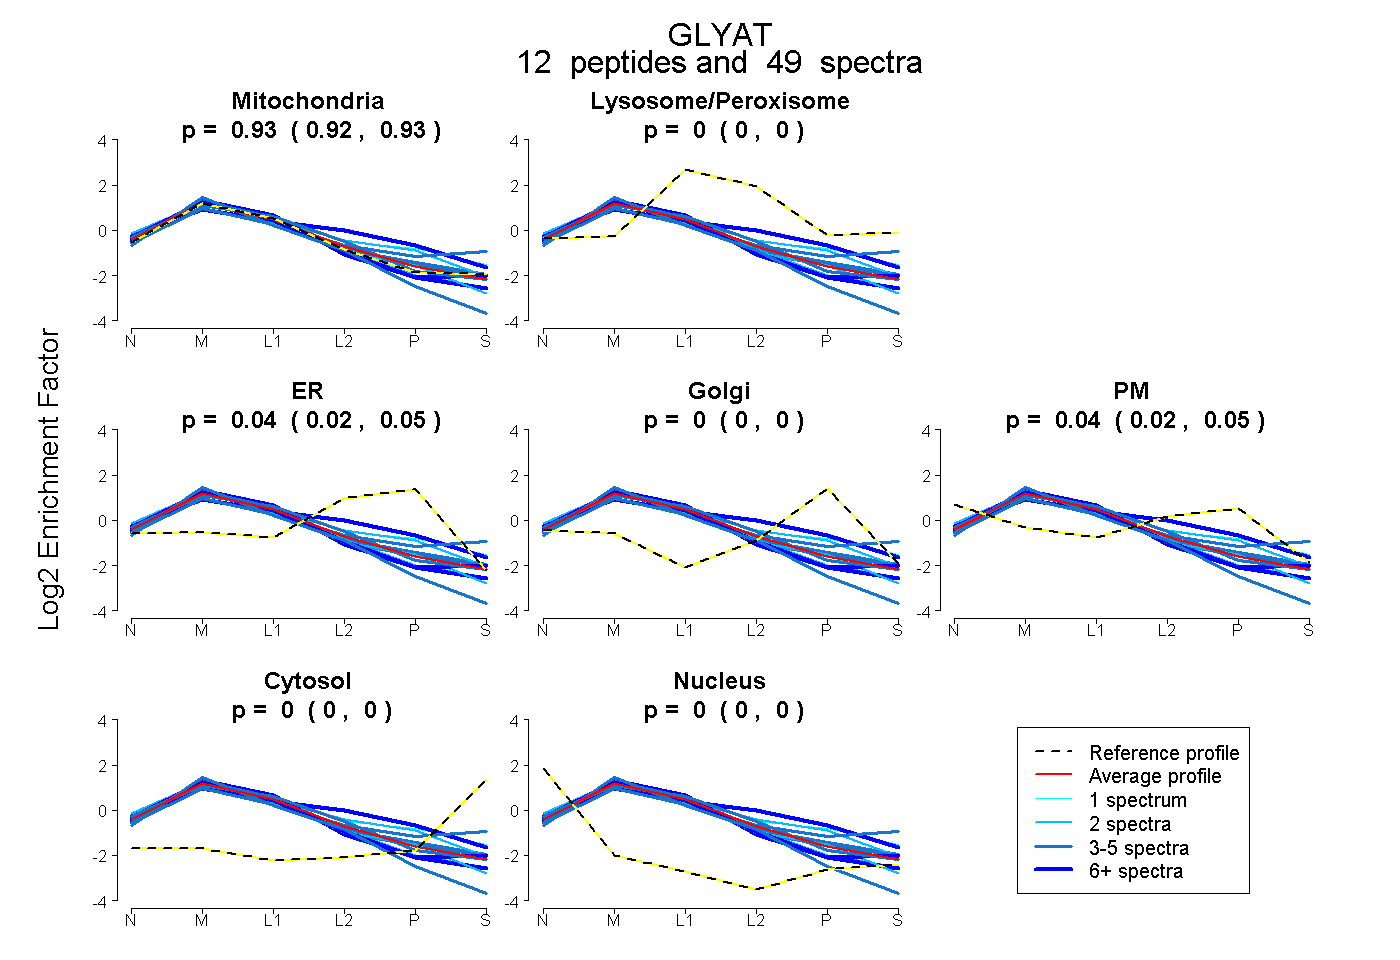
0.917 | 0.933
0.000 | 0.000
0.024 | 0.051
0.000 | 0.000
0.024 | 0.047
0.000 | 0.000
0.000 | 0.000
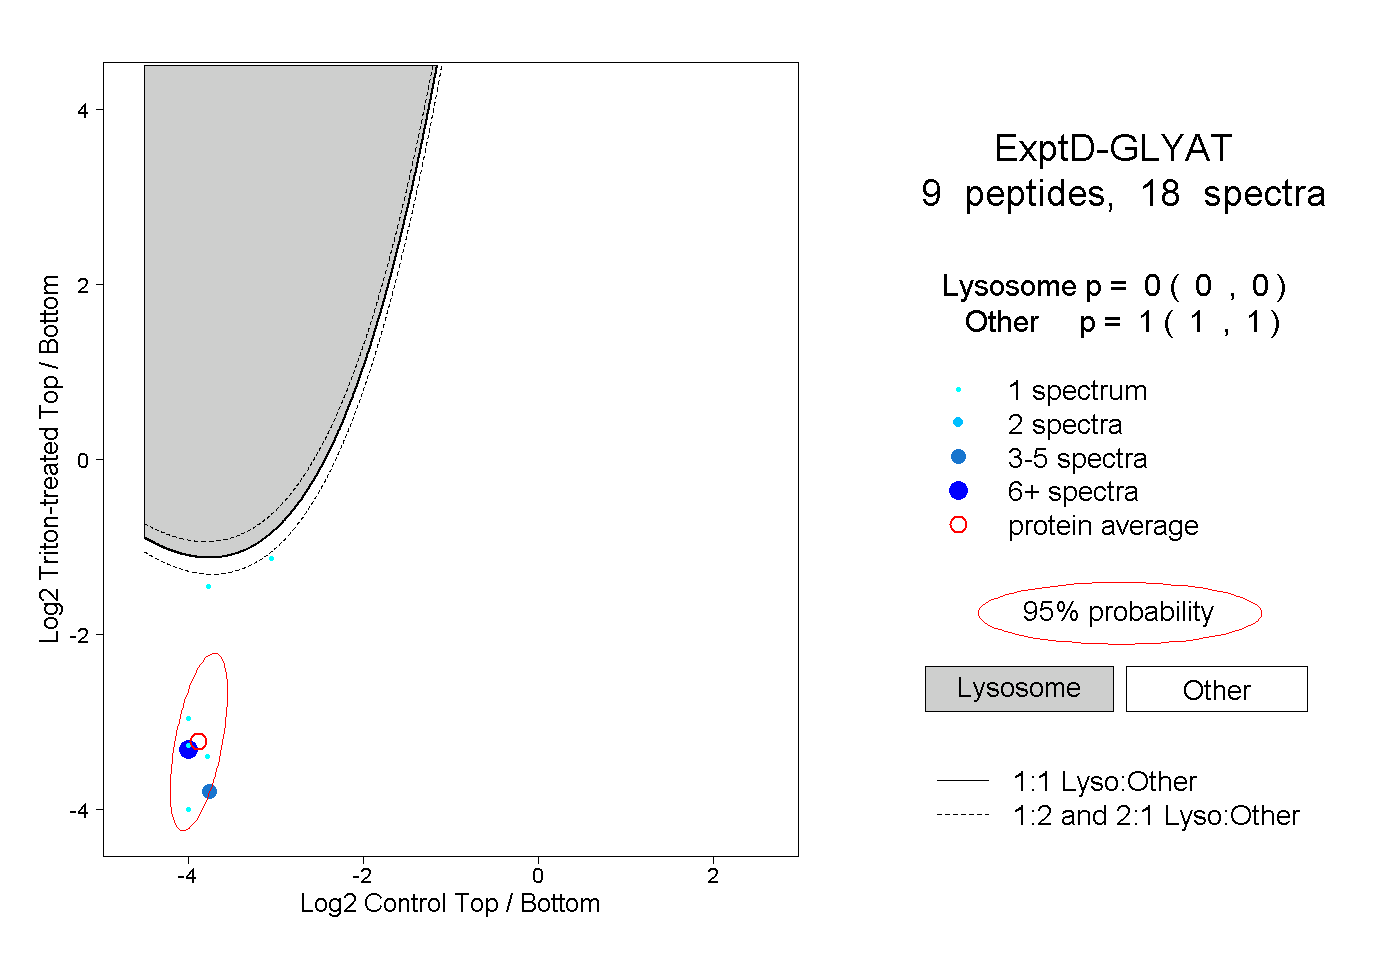
15peptides
spectra
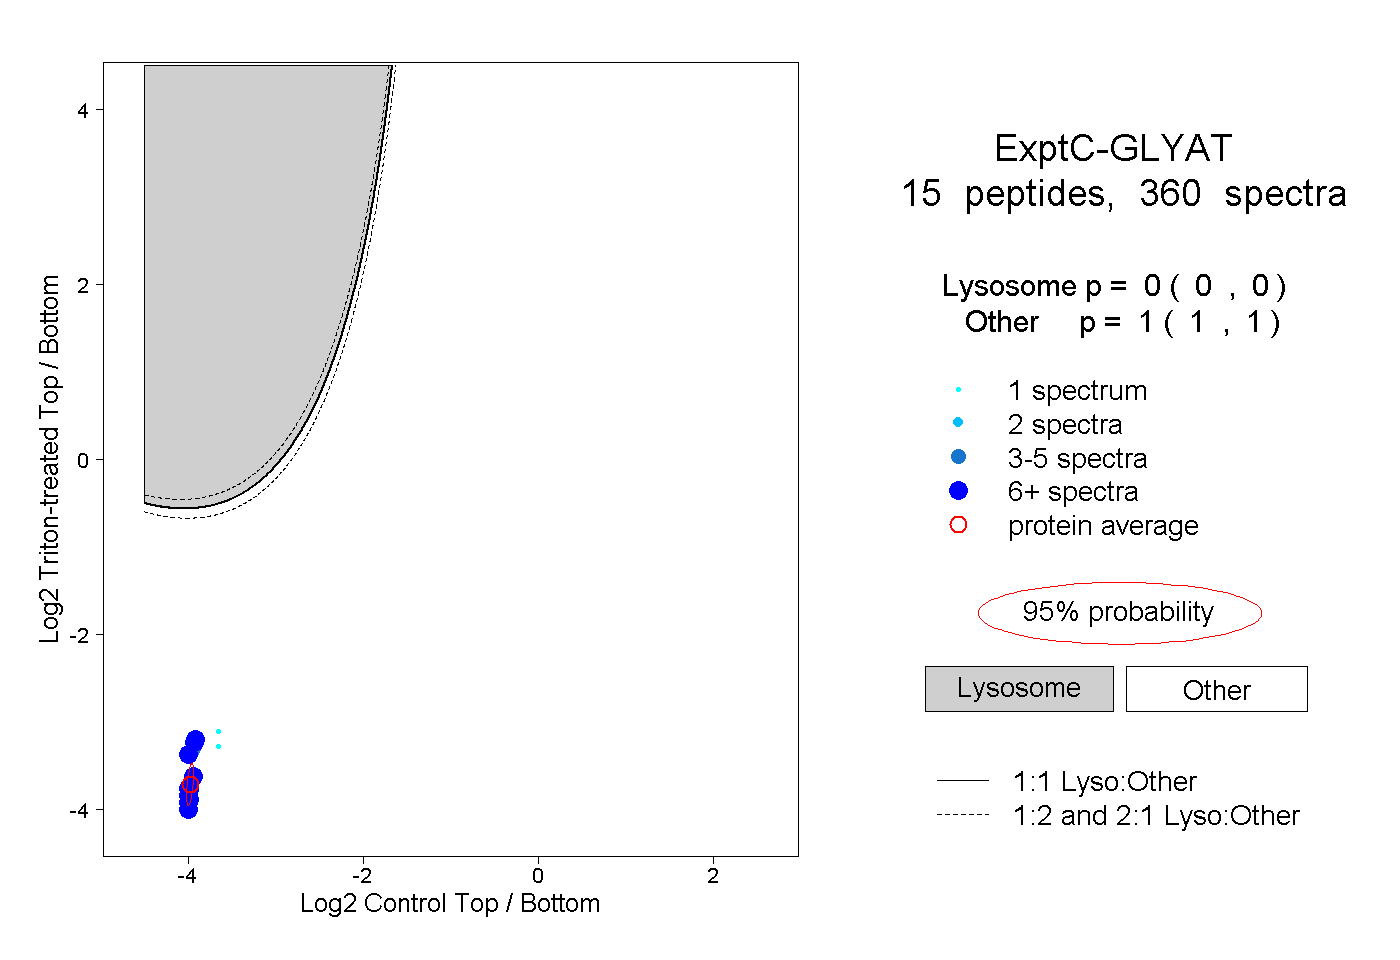
0.000 | 0.000
1.000 | 1.000