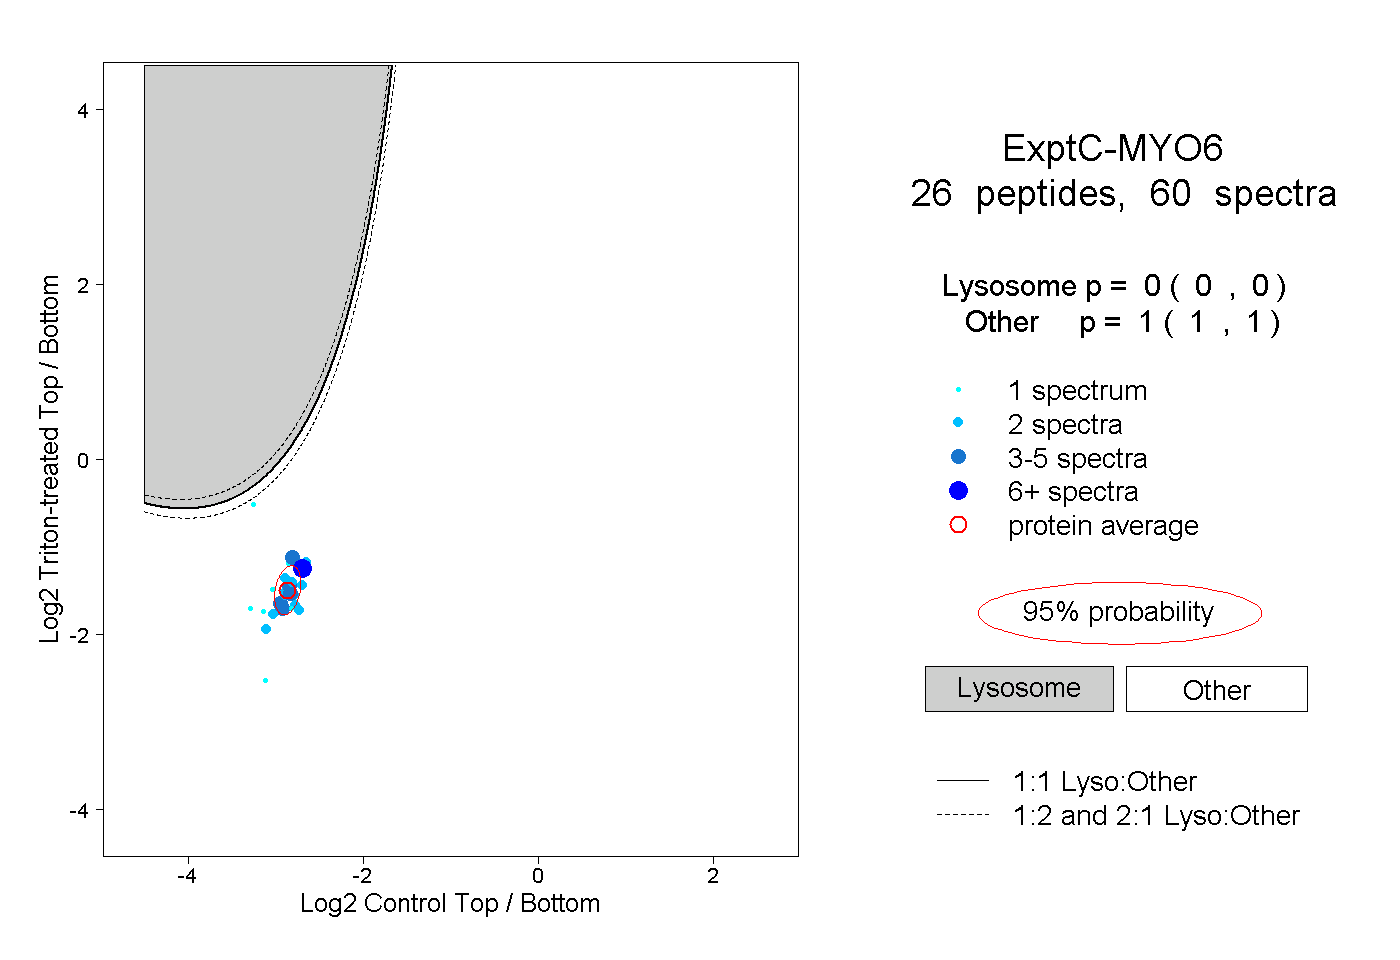
27
27peptides
spectra
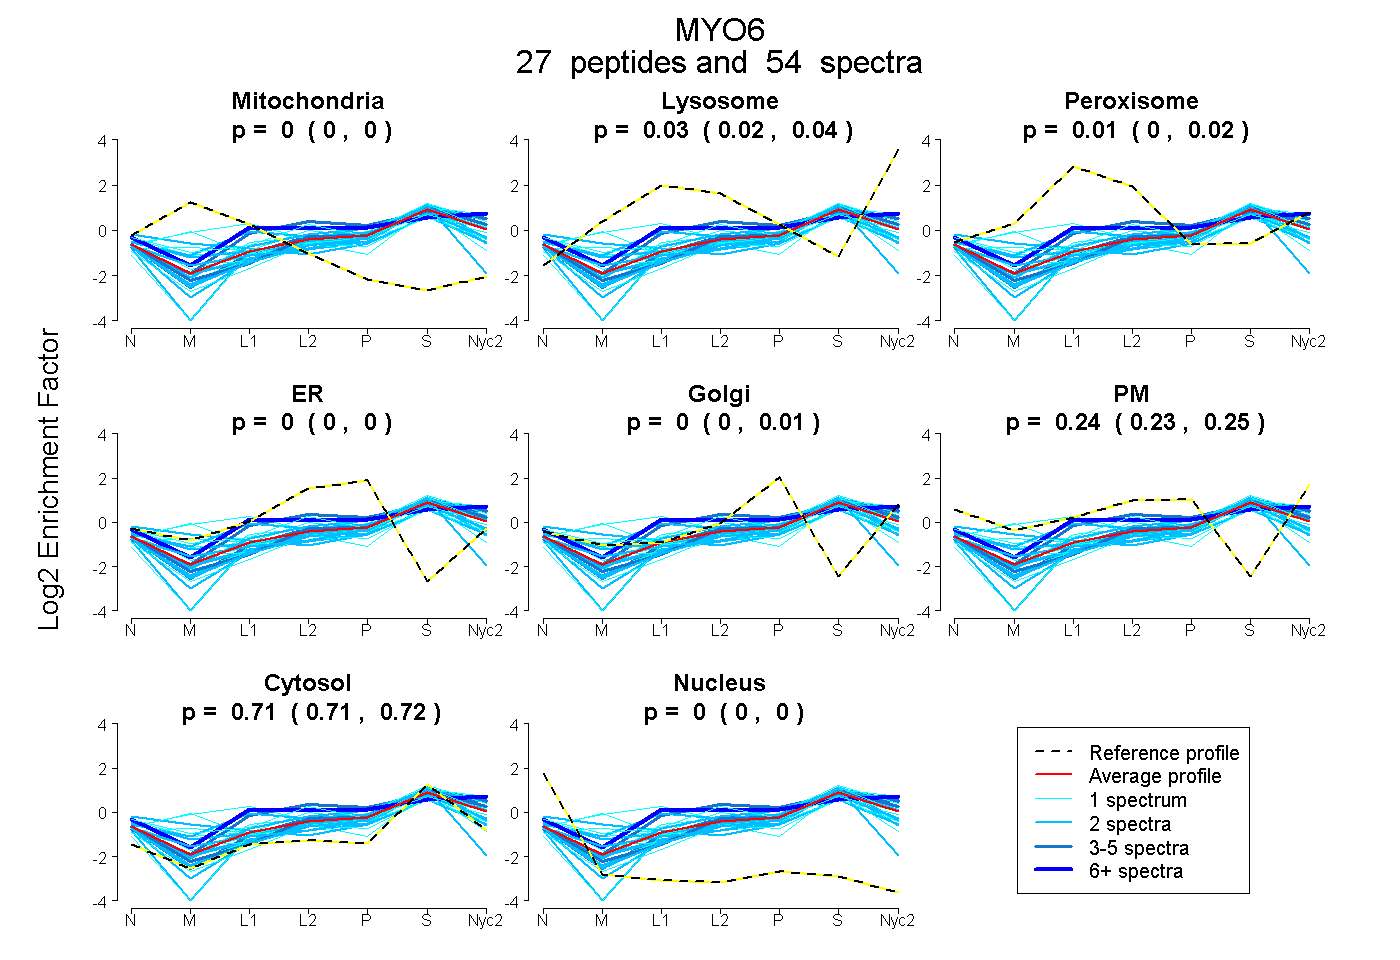
0.000 | 0.000
0.020 | 0.037
0.005 | 0.024
0.000 | 0.004
0.000 | 0.008
0.233 | 0.247
0.707 | 0.715
0.000 | 0.000
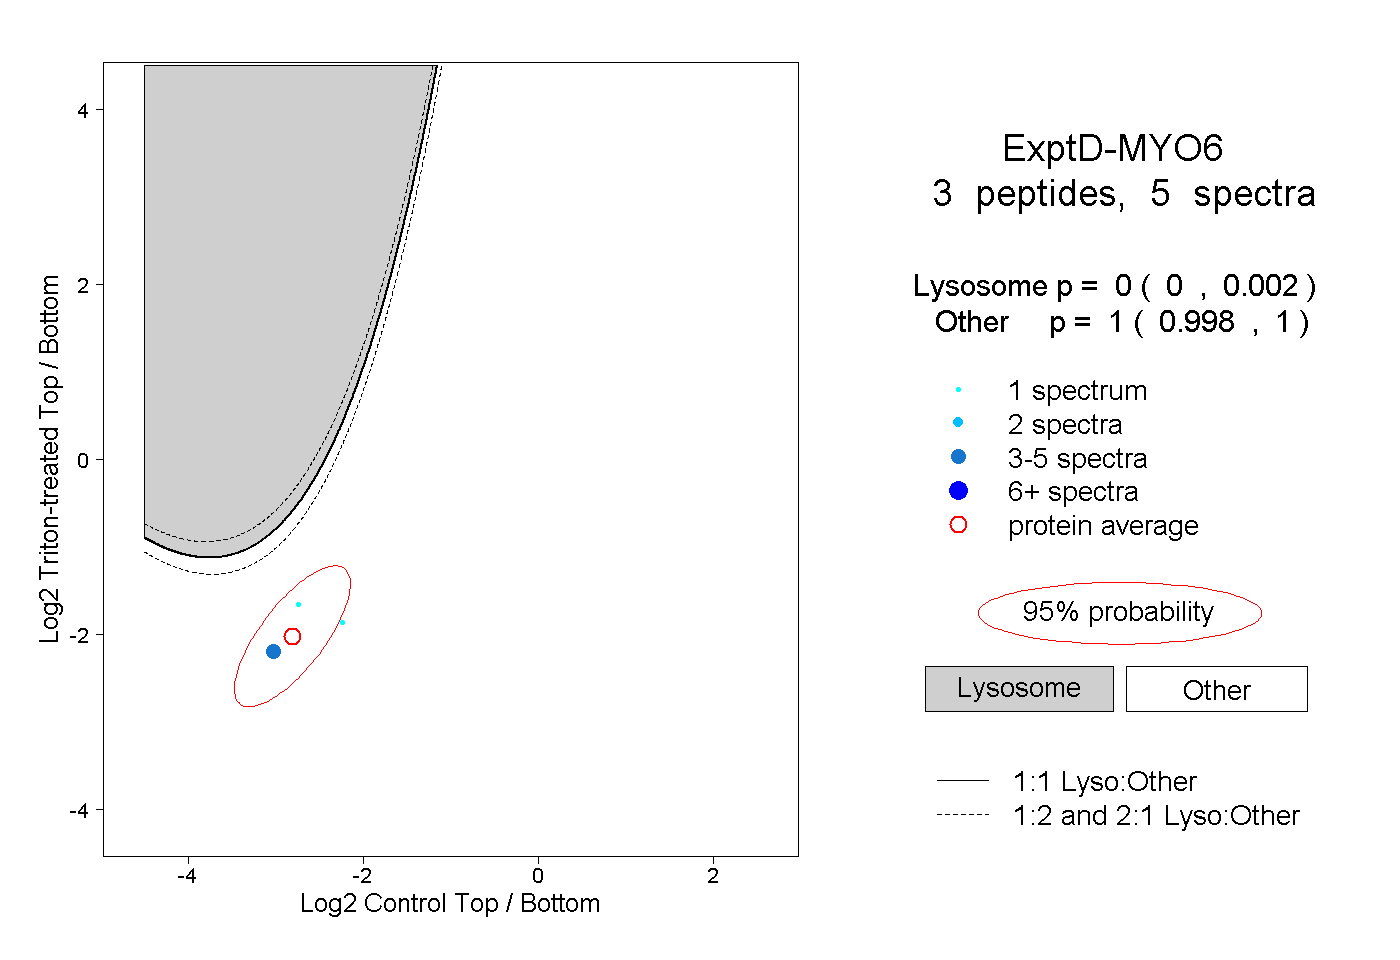
8peptides
spectra
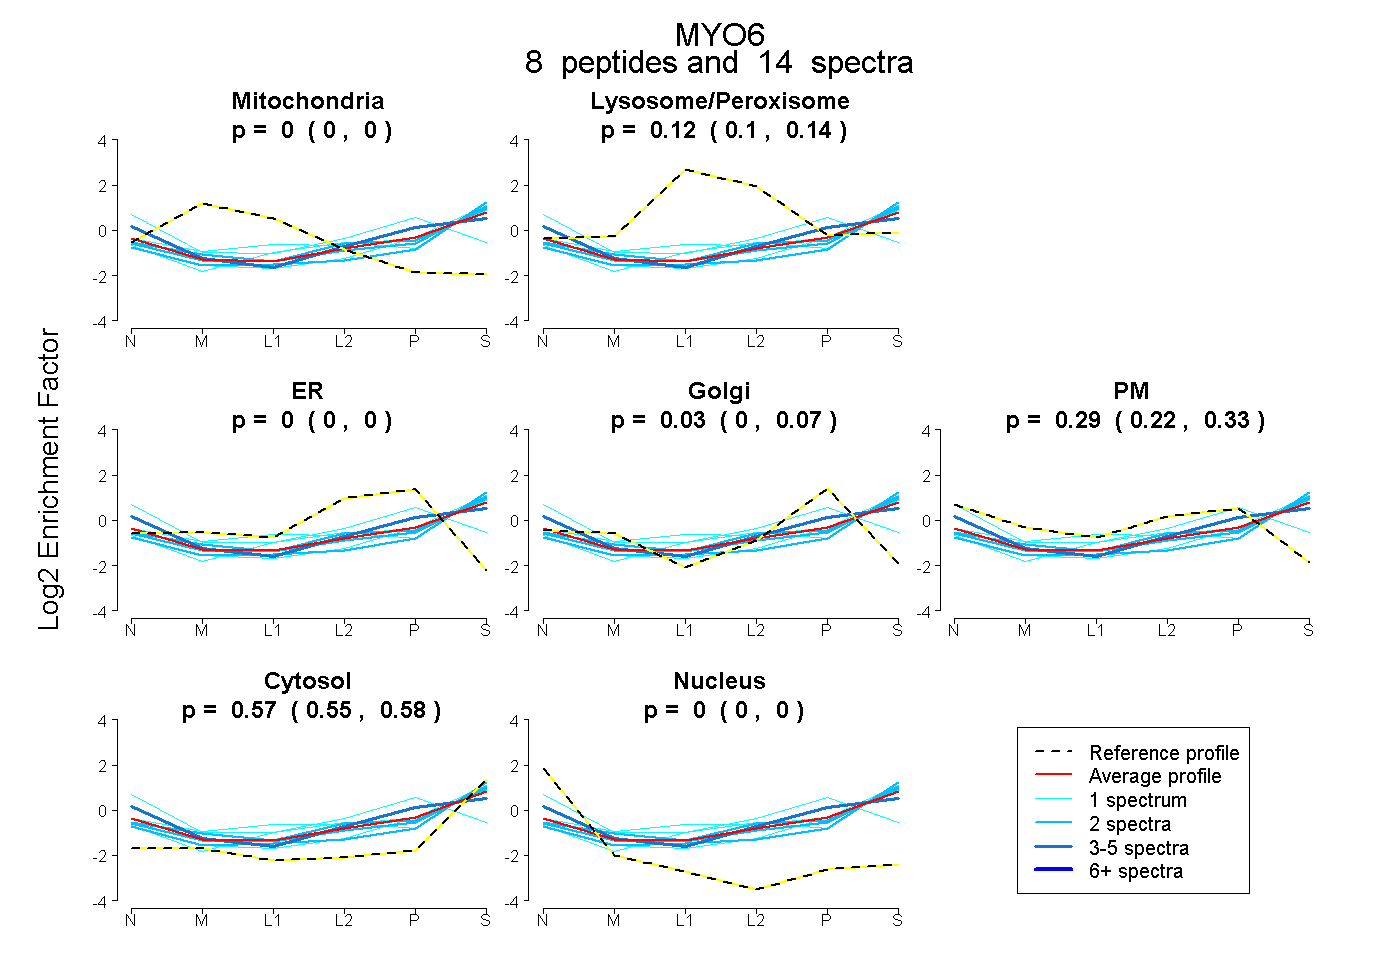
0.000 | 0.000
0.100 | 0.140
0.000 | 0.000
0.000 | 0.074
0.219 | 0.329
0.545 | 0.579
0.000 | 0.000