 31
31peptides
spectra
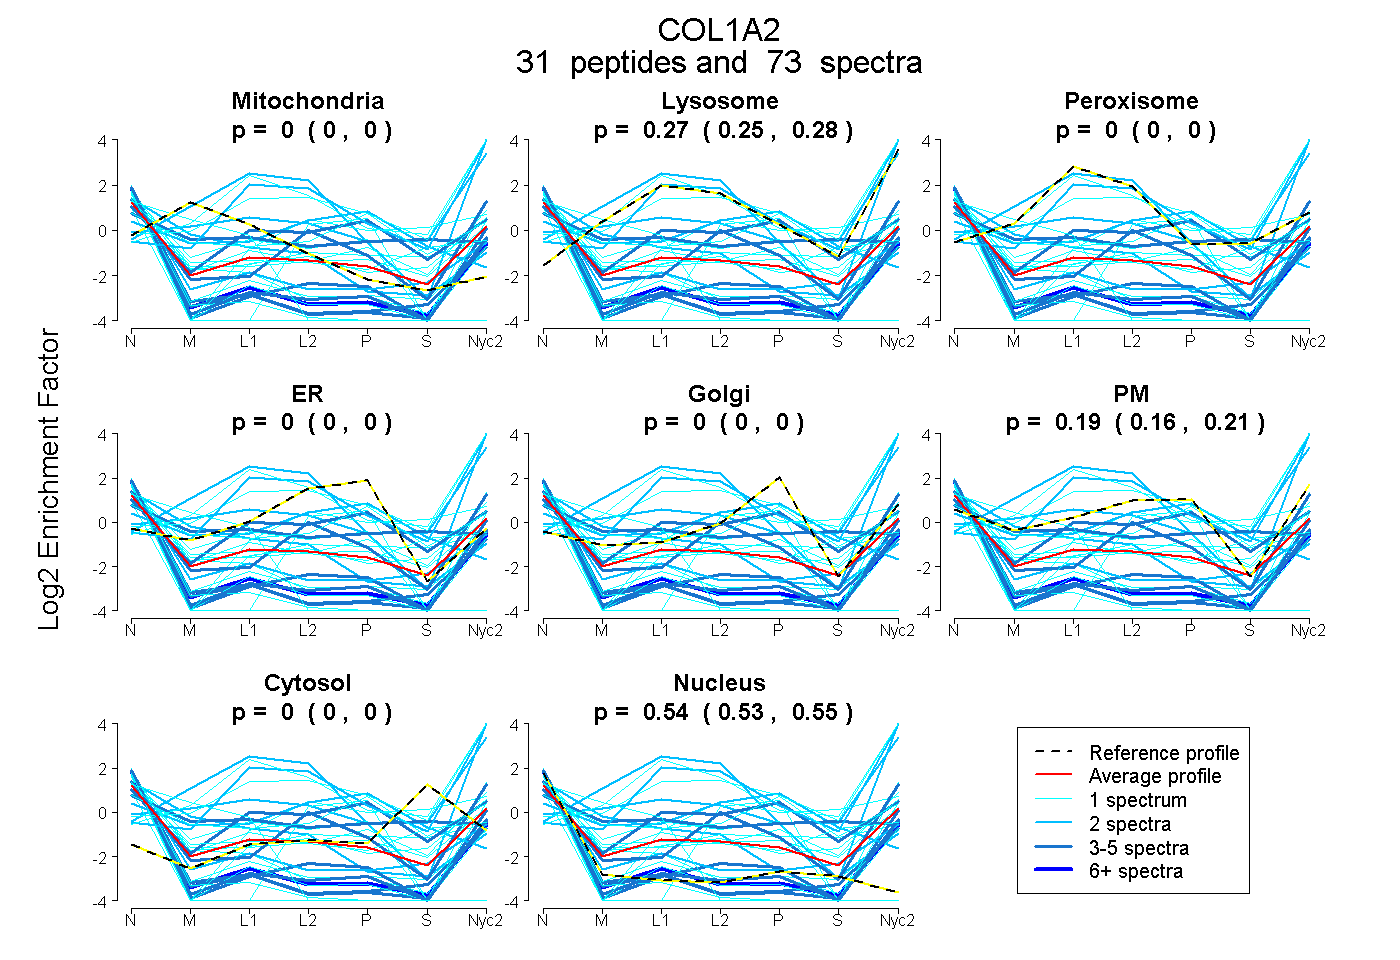
0.000 | 0.000
0.249 | 0.285
0.000 | 0.000
0.000 | 0.000
0.000 | 0.000
0.160 | 0.208
0.000 | 0.000
0.534 | 0.553
2peptides
spectra
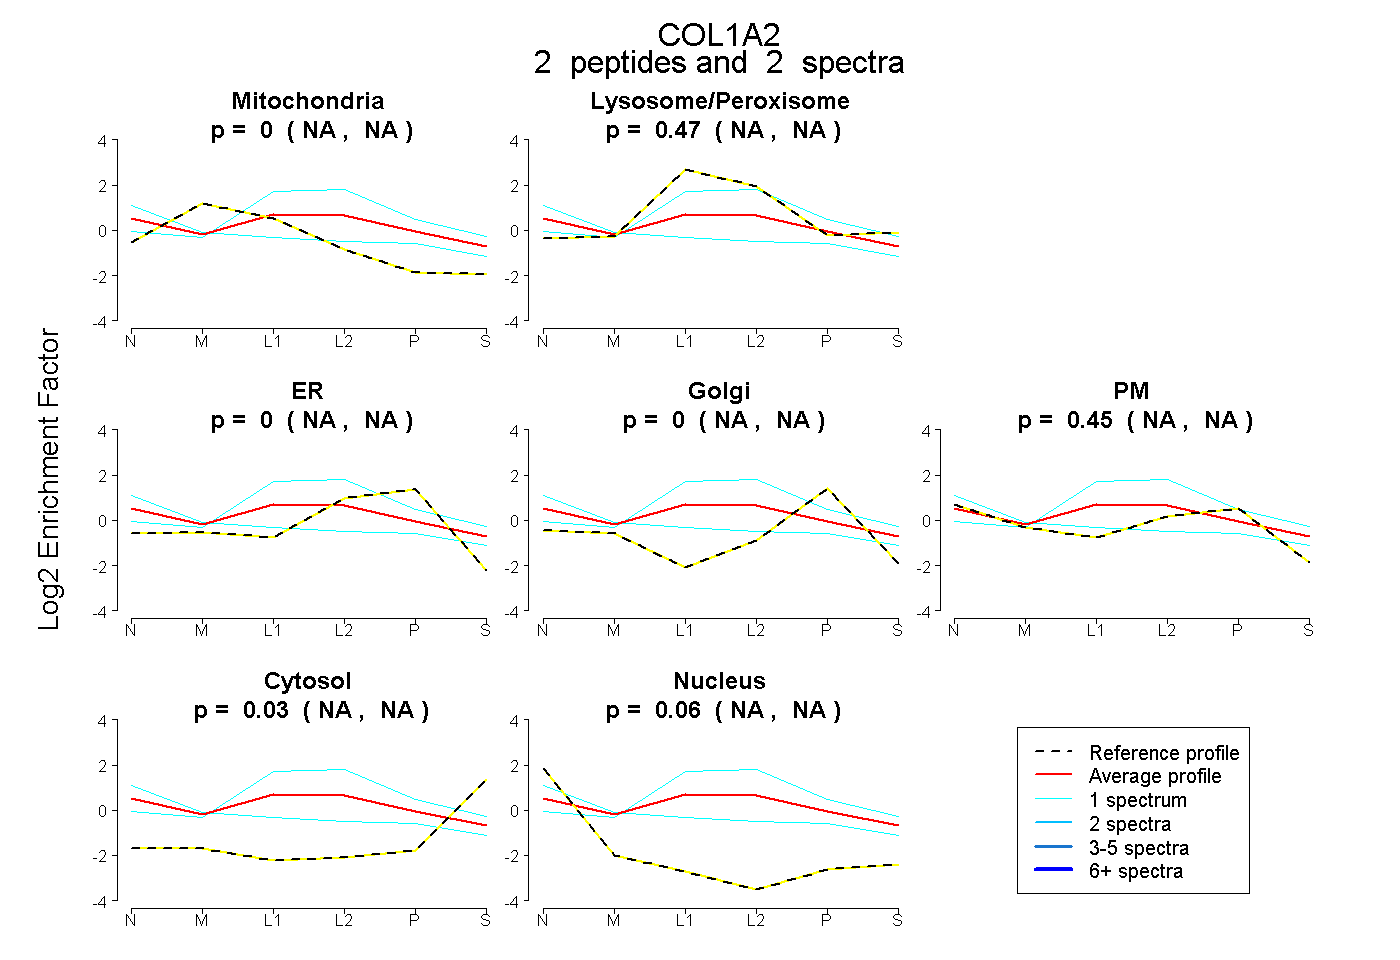
NA | NA
NA | NA
NA | NA
NA | NA
NA | NA
NA | NA
NA | NA
28peptides
spectra
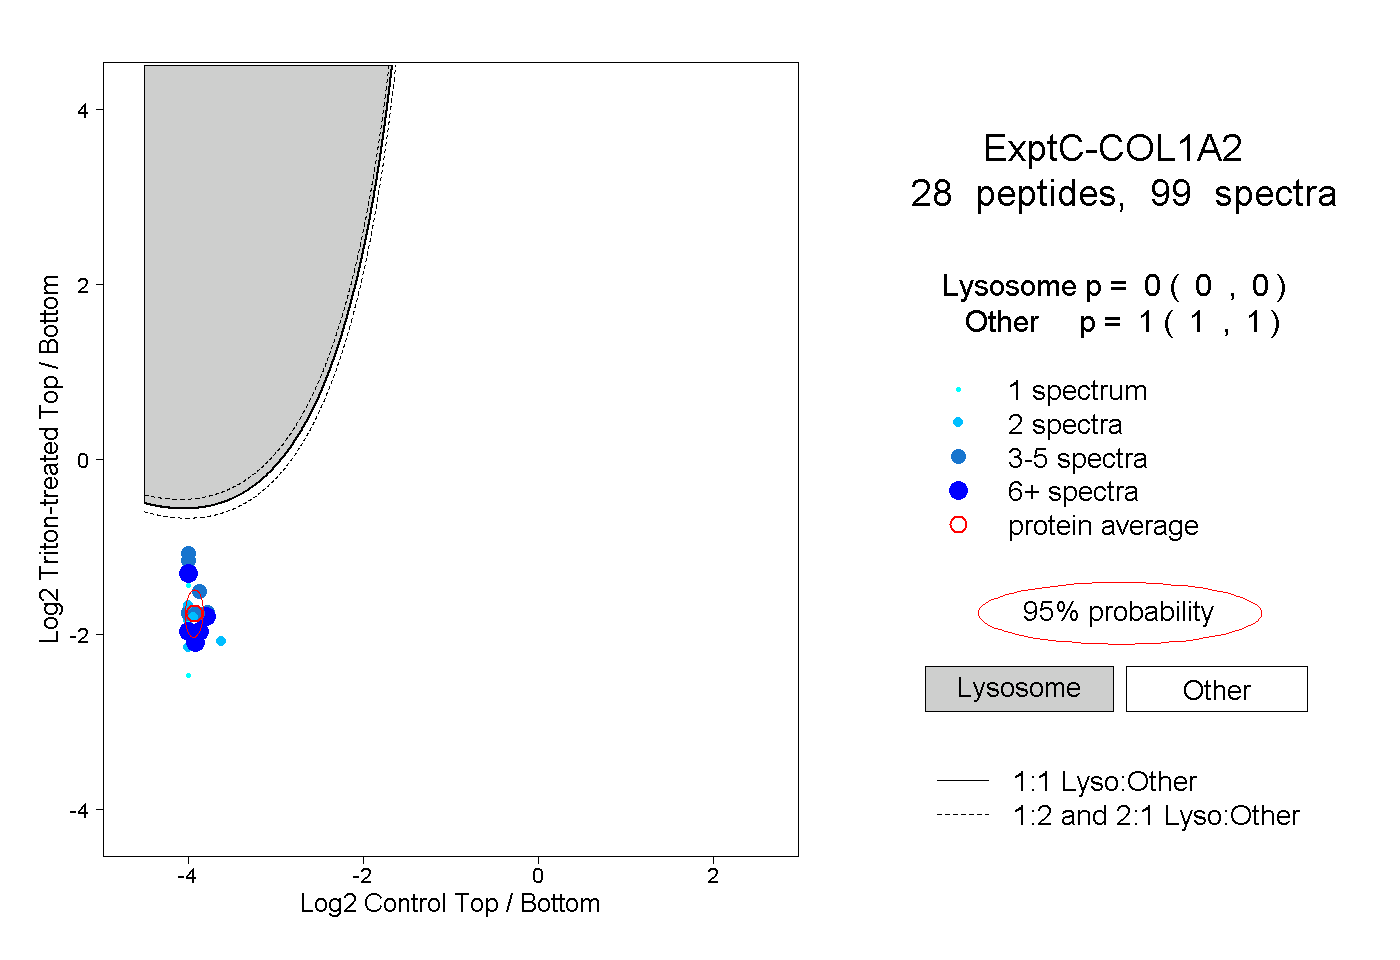
0.000 | 0.000
1.000 | 1.000
8peptides
spectra
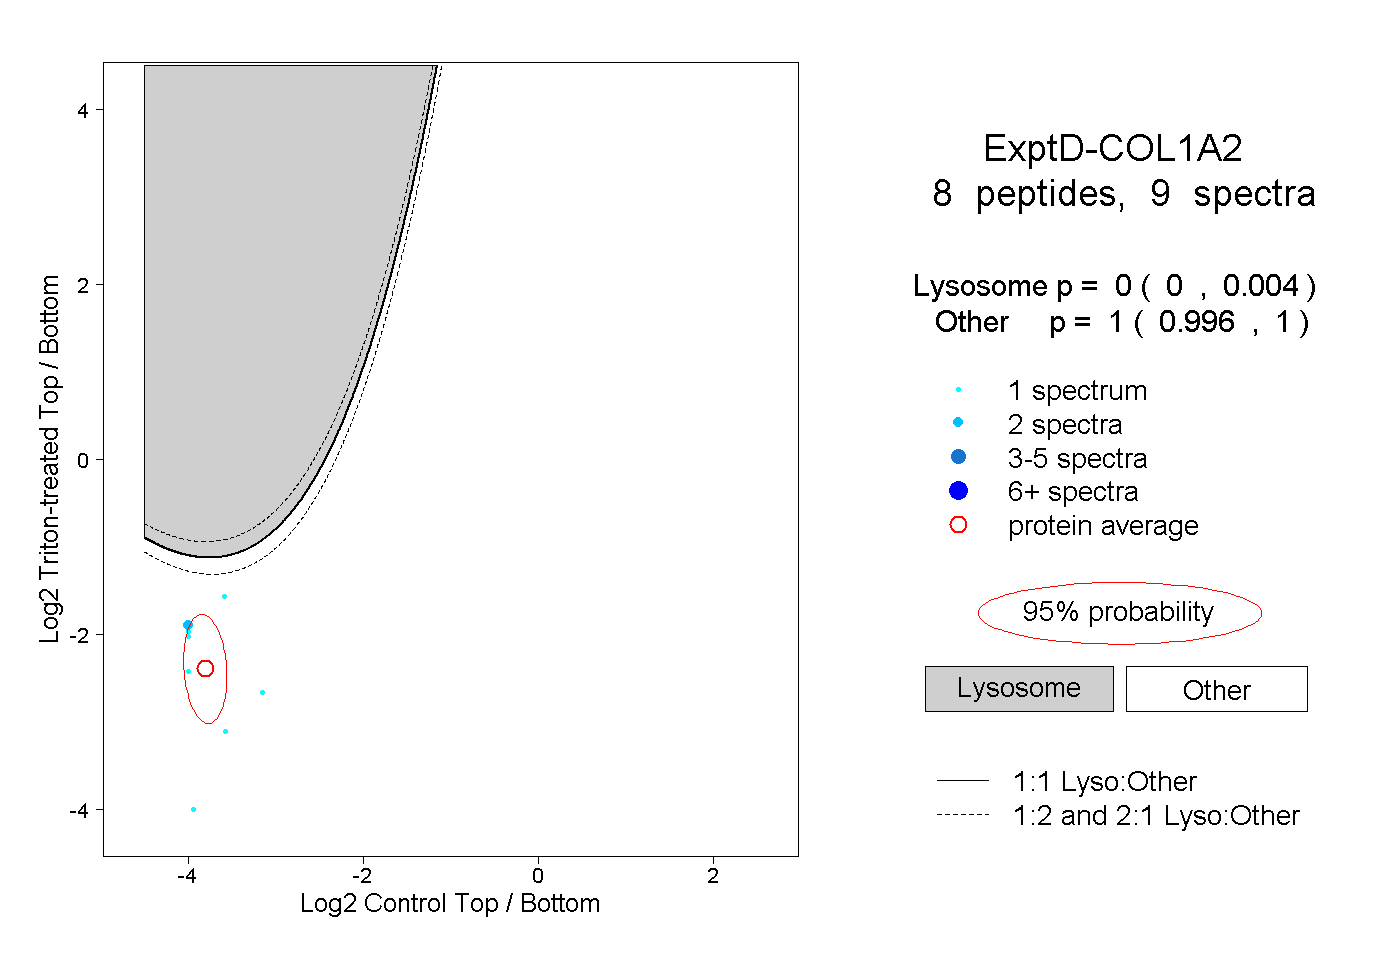
0.000 | 0.004
0.996 | 1.000