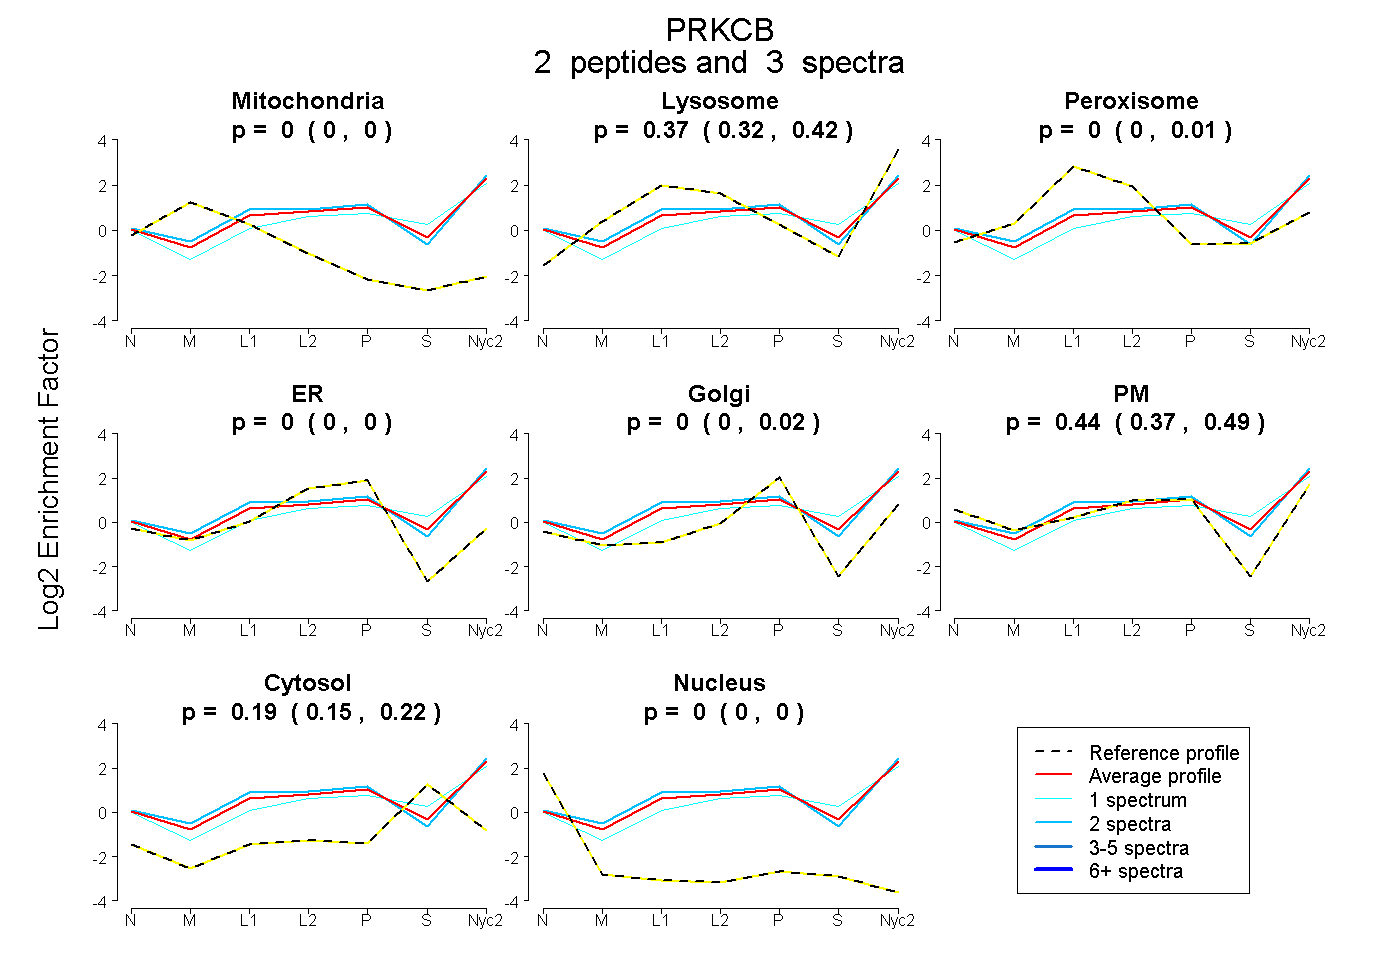
 2
2peptides
spectra
0.000 | 0.000
0.318 | 0.418
0.000 | 0.015
0.000 | 0.000
0.000 | 0.018
0.370 | 0.492
0.147 | 0.216
0.000 | 0.000
| Plot | Mito | Lyso | Perox | ER | Golgi | PM | Cytosol | Nucleus | |||||
| Expt A |
2 peptides |
3 spectra |
|
0.000 0.000 | 0.000 |
0.373 0.318 | 0.418 |
0.000 0.000 | 0.015 |
0.000 0.000 | 0.000 |
0.000 0.000 | 0.018 |
0.442 0.370 | 0.492 |
0.185 0.147 | 0.216 |
0.000 0.000 | 0.000 |
| 1 spectrum, GPASDDPR | 0.000 | 0.315 | 0.000 | 0.000 | 0.000 | 0.356 | 0.329 | 0.000 | ||
| 2 spectra, YIDWEK | 0.000 | 0.402 | 0.000 | 0.000 | 0.000 | 0.484 | 0.113 | 0.000 |
| Plot | Lyso | Other | |||||||||||
| Expt C |
3 peptides |
6 spectra |
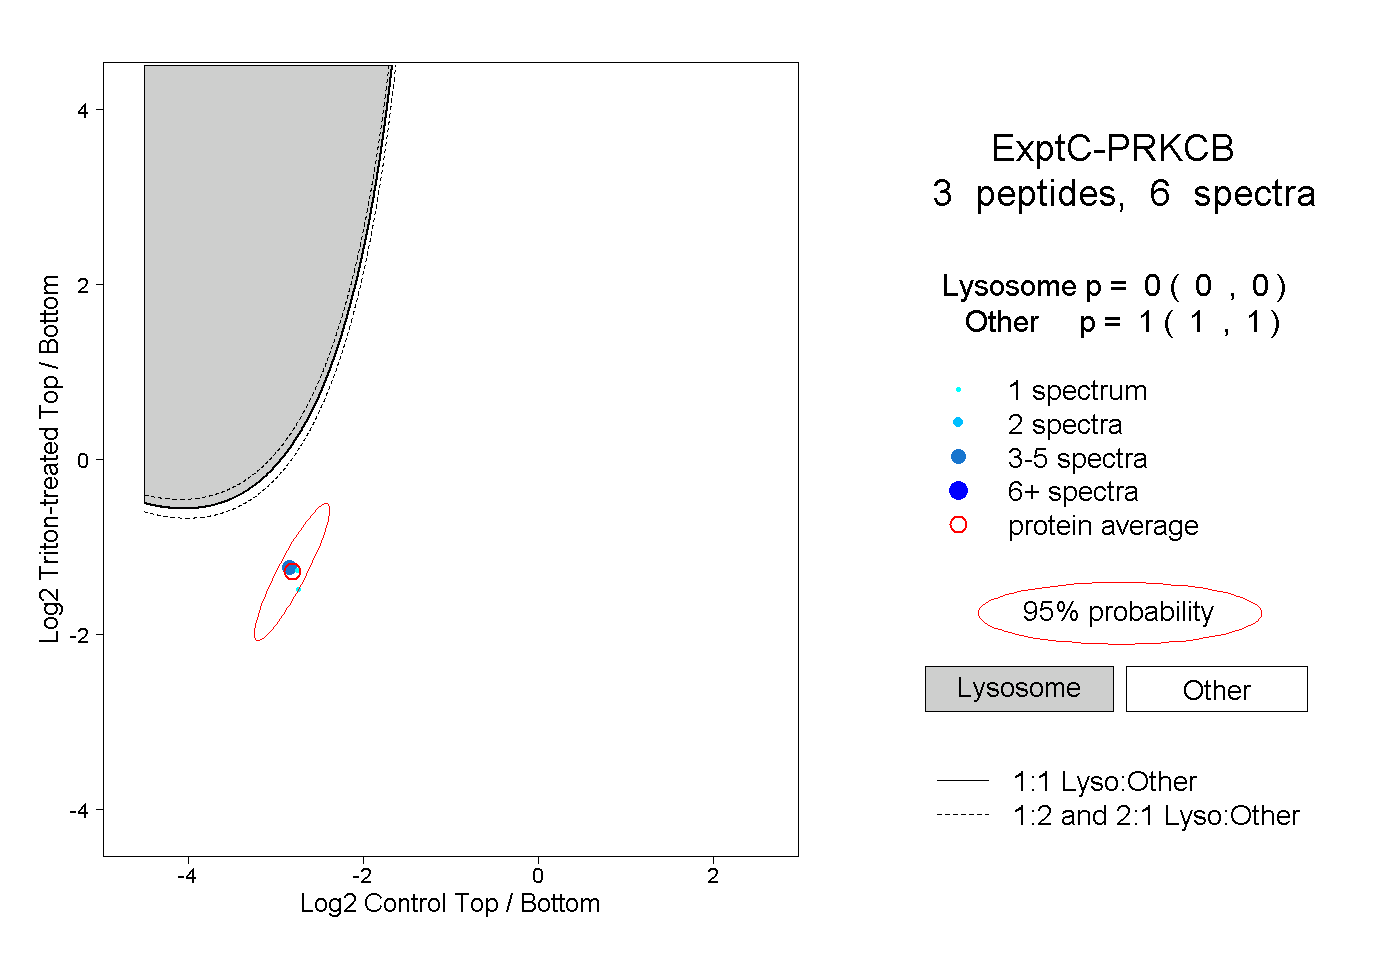 |
0.000 0.000 | 0.000 |
1.000 1.000 | 1.000 |