 20
20peptides
spectra
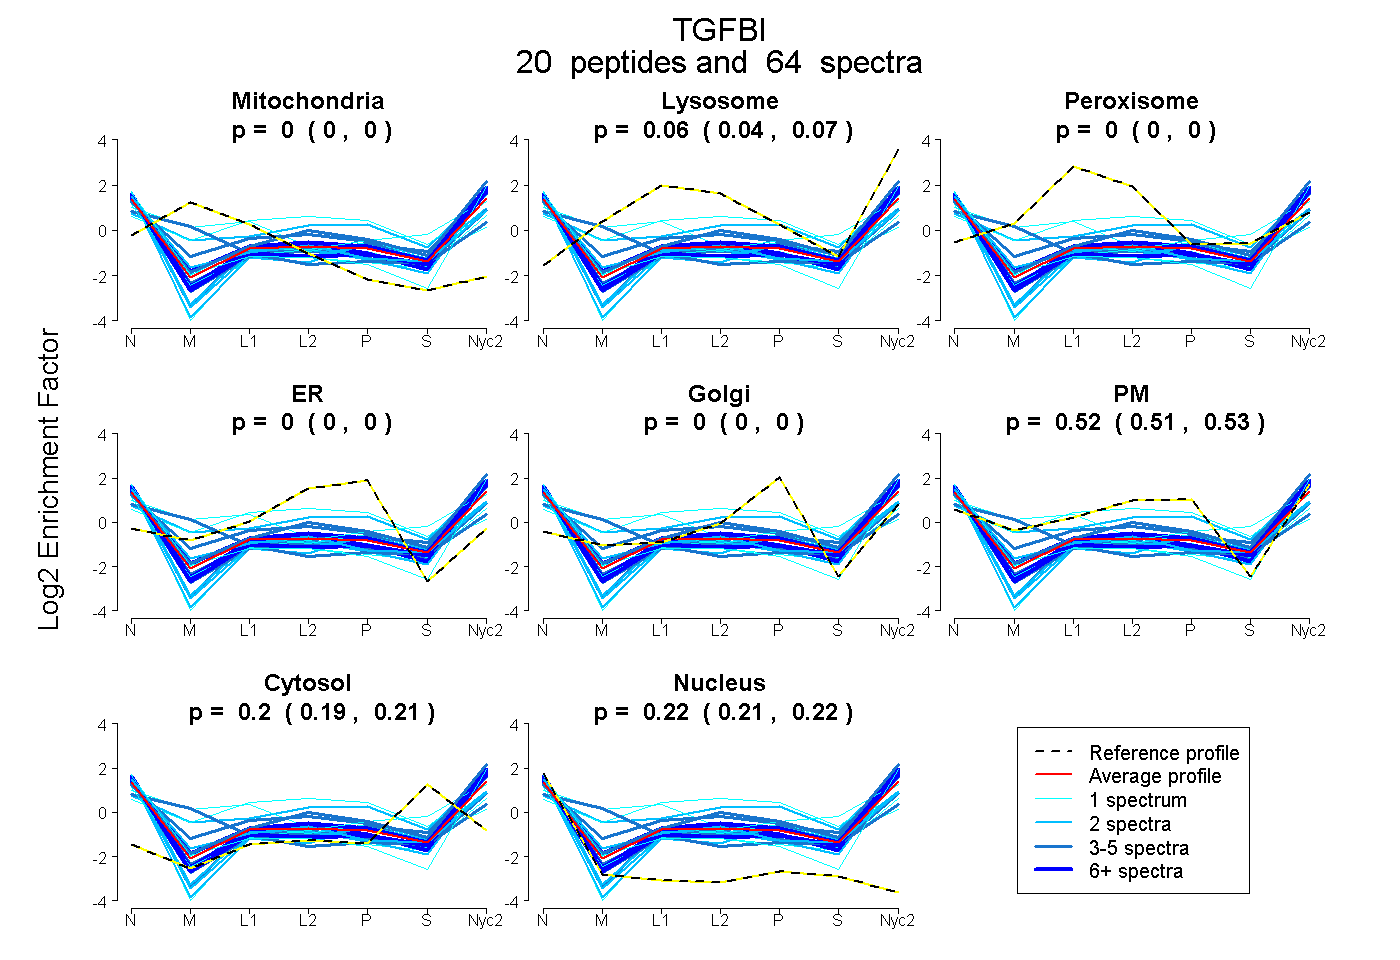
0.000 | 0.000
0.044 | 0.070
0.000 | 0.000
0.000 | 0.000
0.000 | 0.000
0.508 | 0.534
0.193 | 0.209
0.210 | 0.224
5peptides
spectra
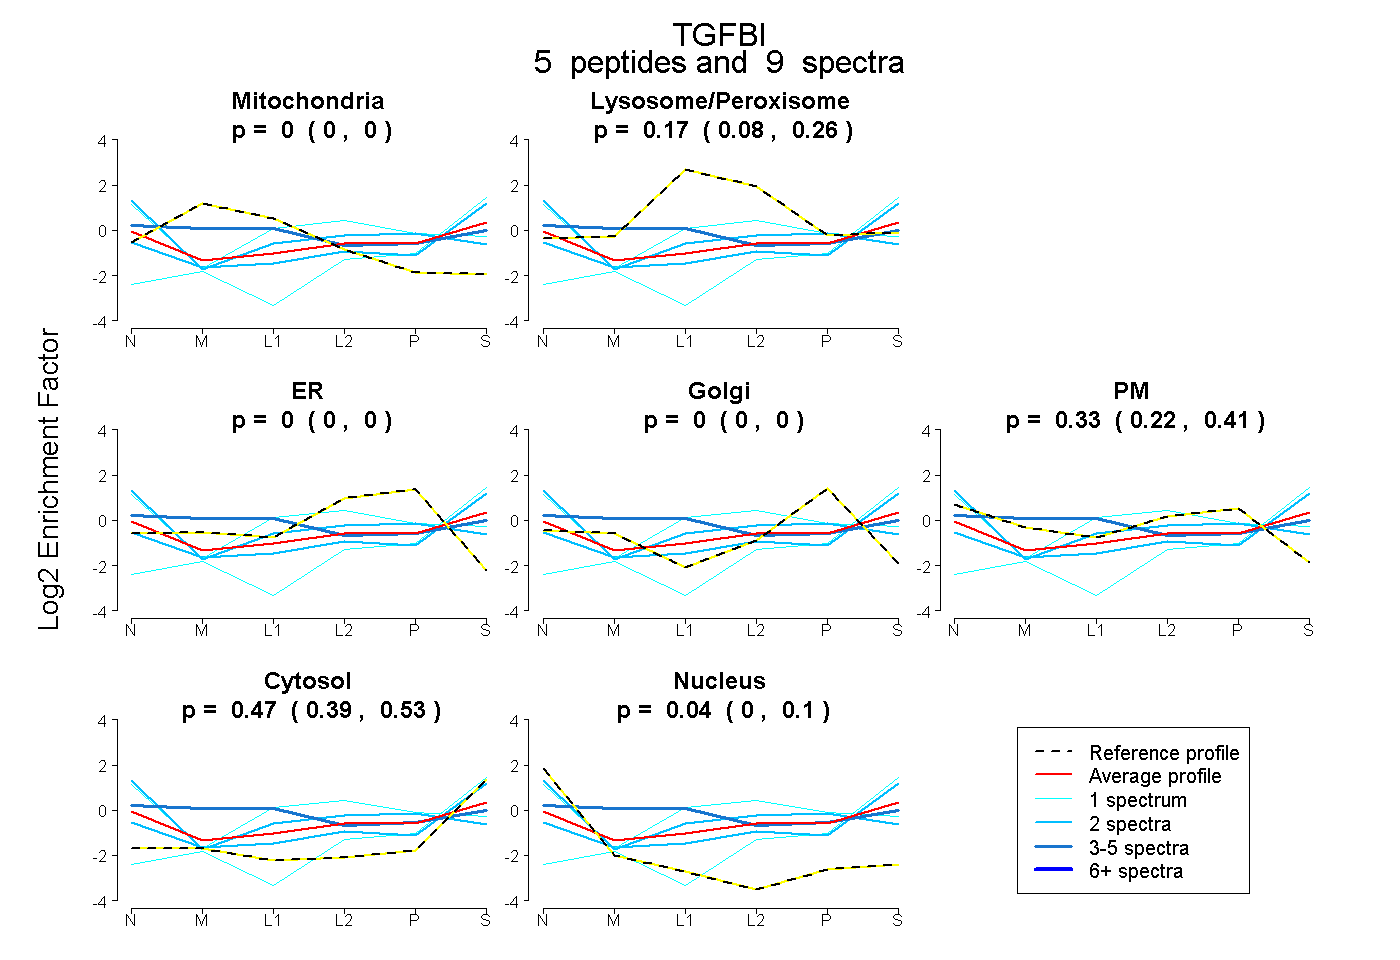
0.000 | 0.000
0.083 | 0.260
0.000 | 0.000
0.000 | 0.000
0.215 | 0.406
0.386 | 0.530
0.000 | 0.098
19peptides
spectra

0.000 | 0.000
1.000 | 1.000
5peptides
spectra
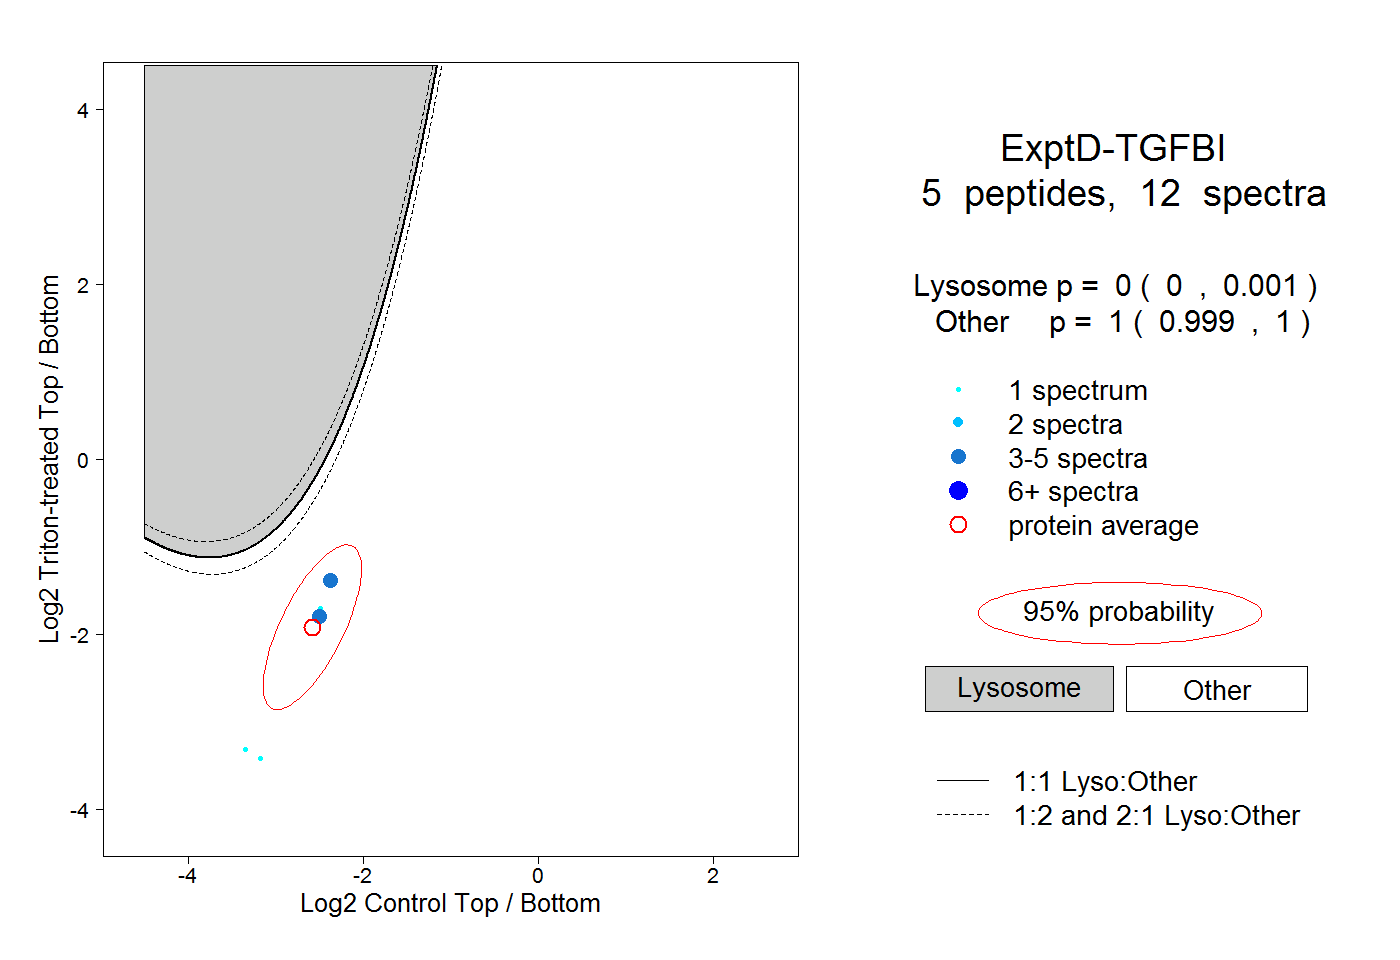
0.000 | 0.001
0.999 | 1.000