9
9peptides
spectra
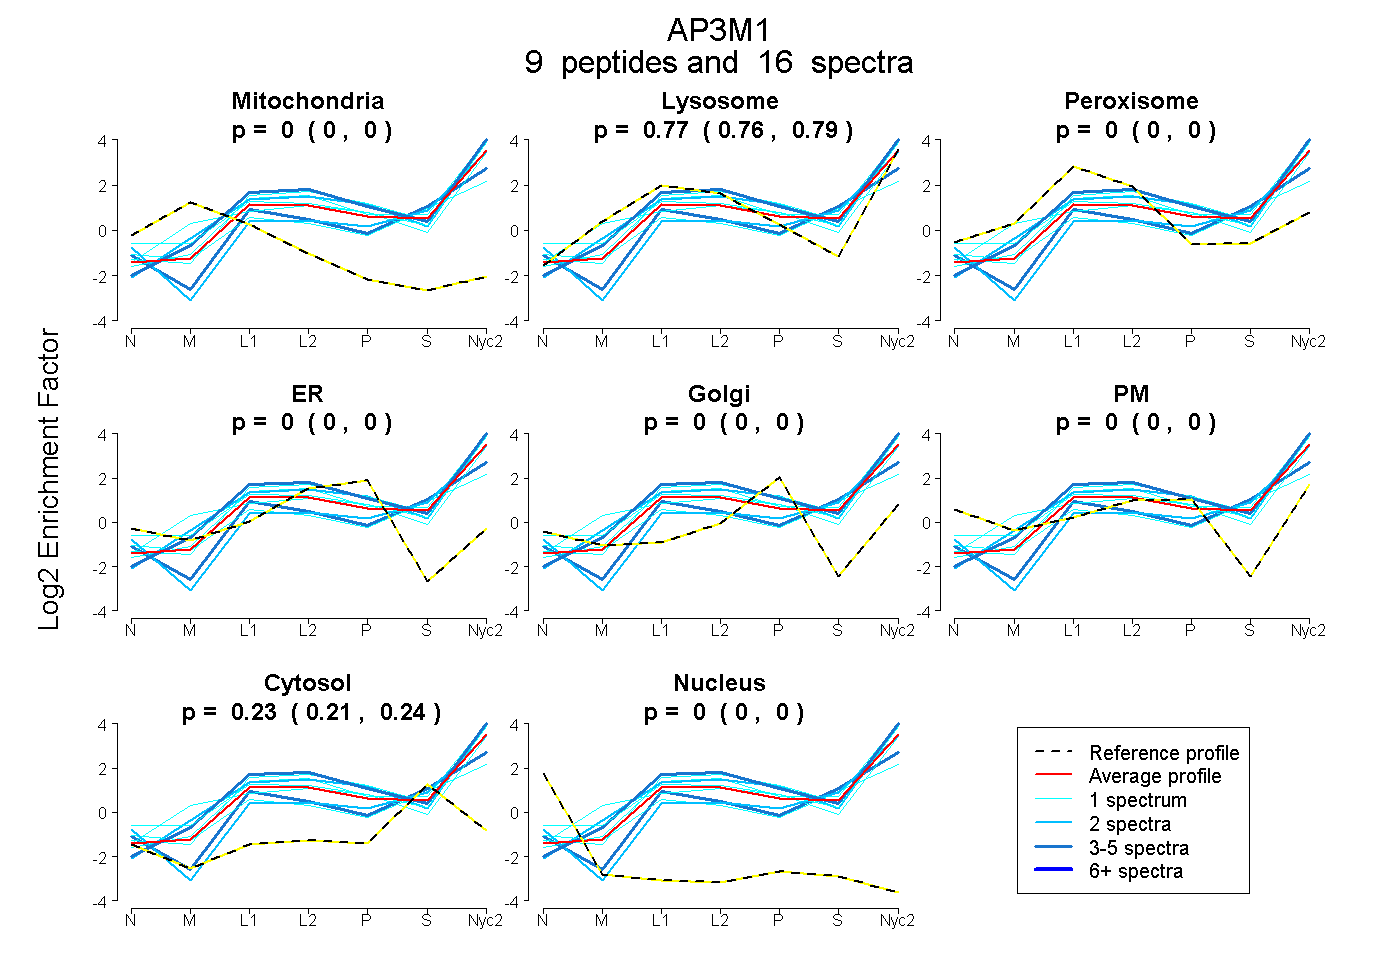
0.000 | 0.000
0.758 | 0.785
0.000 | 0.000
0.000 | 0.000
0.000 | 0.000
0.000 | 0.000
0.213 | 0.239
0.000 | 0.000
5peptides
spectra
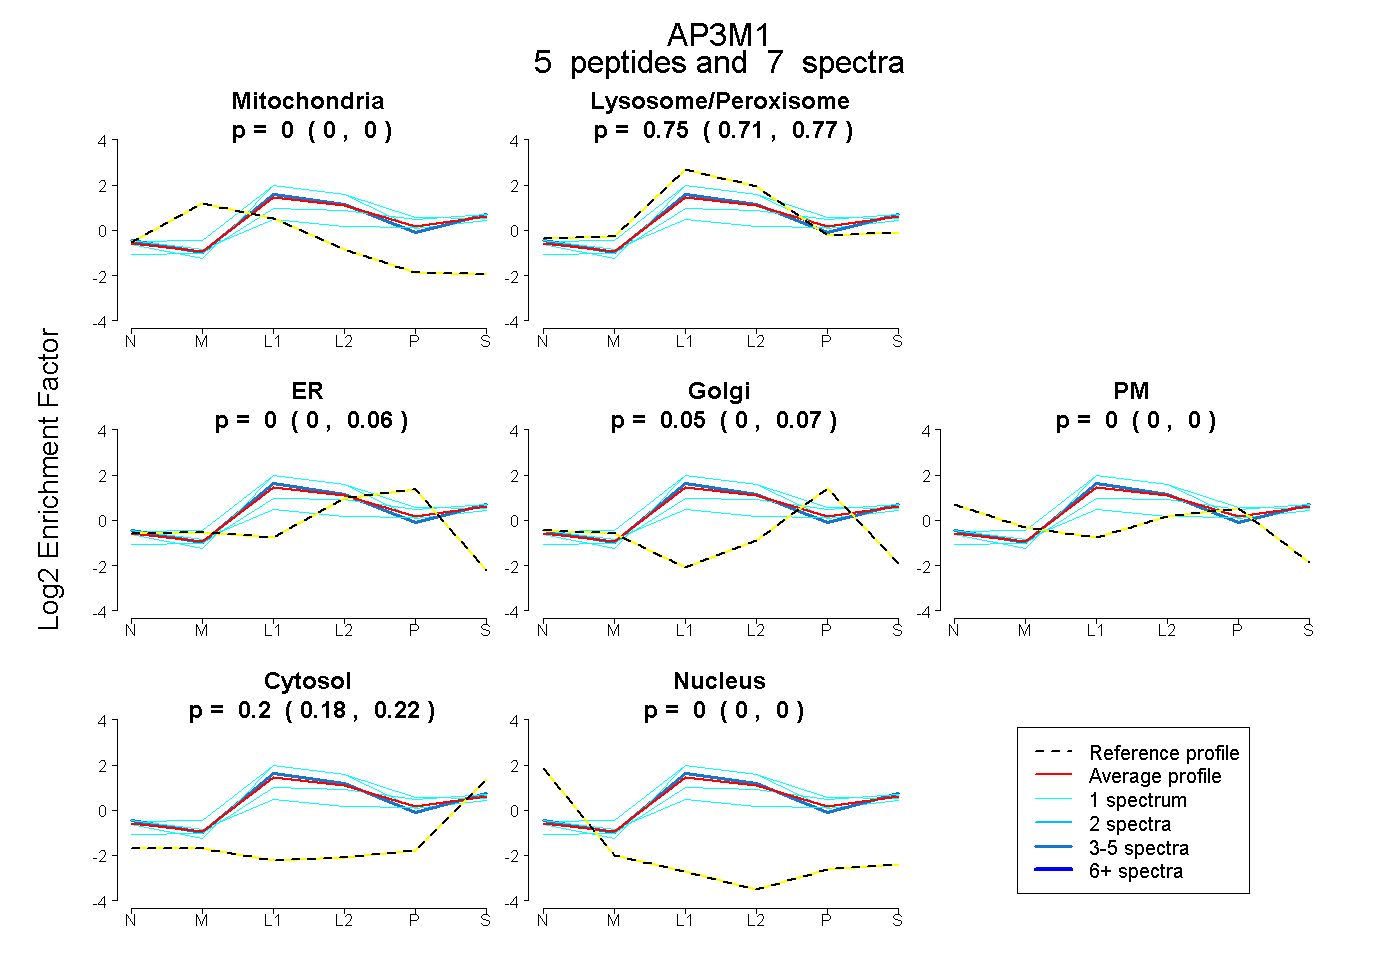
0.000 | 0.000
0.711 | 0.773
0.000 | 0.062
0.000 | 0.070
0.000 | 0.000
0.176 | 0.219
0.000 | 0.000