 42
42peptides
spectra
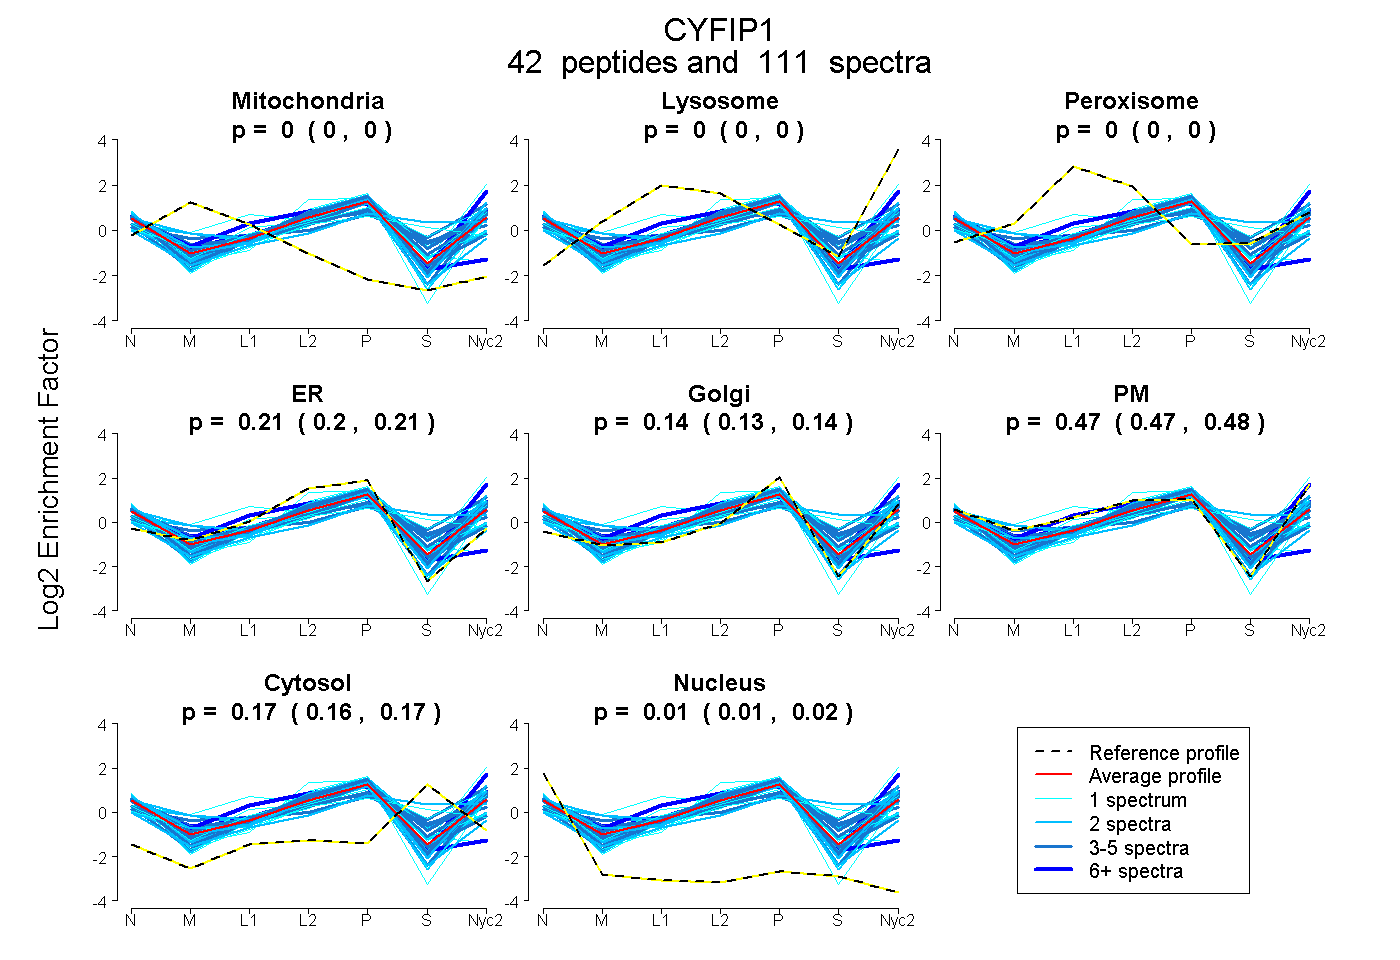
0.000 | 0.000
0.000 | 0.000
0.000 | 0.000
0.201 | 0.214
0.133 | 0.143
0.469 | 0.479
0.162 | 0.169
0.011 | 0.015
12peptides
spectra
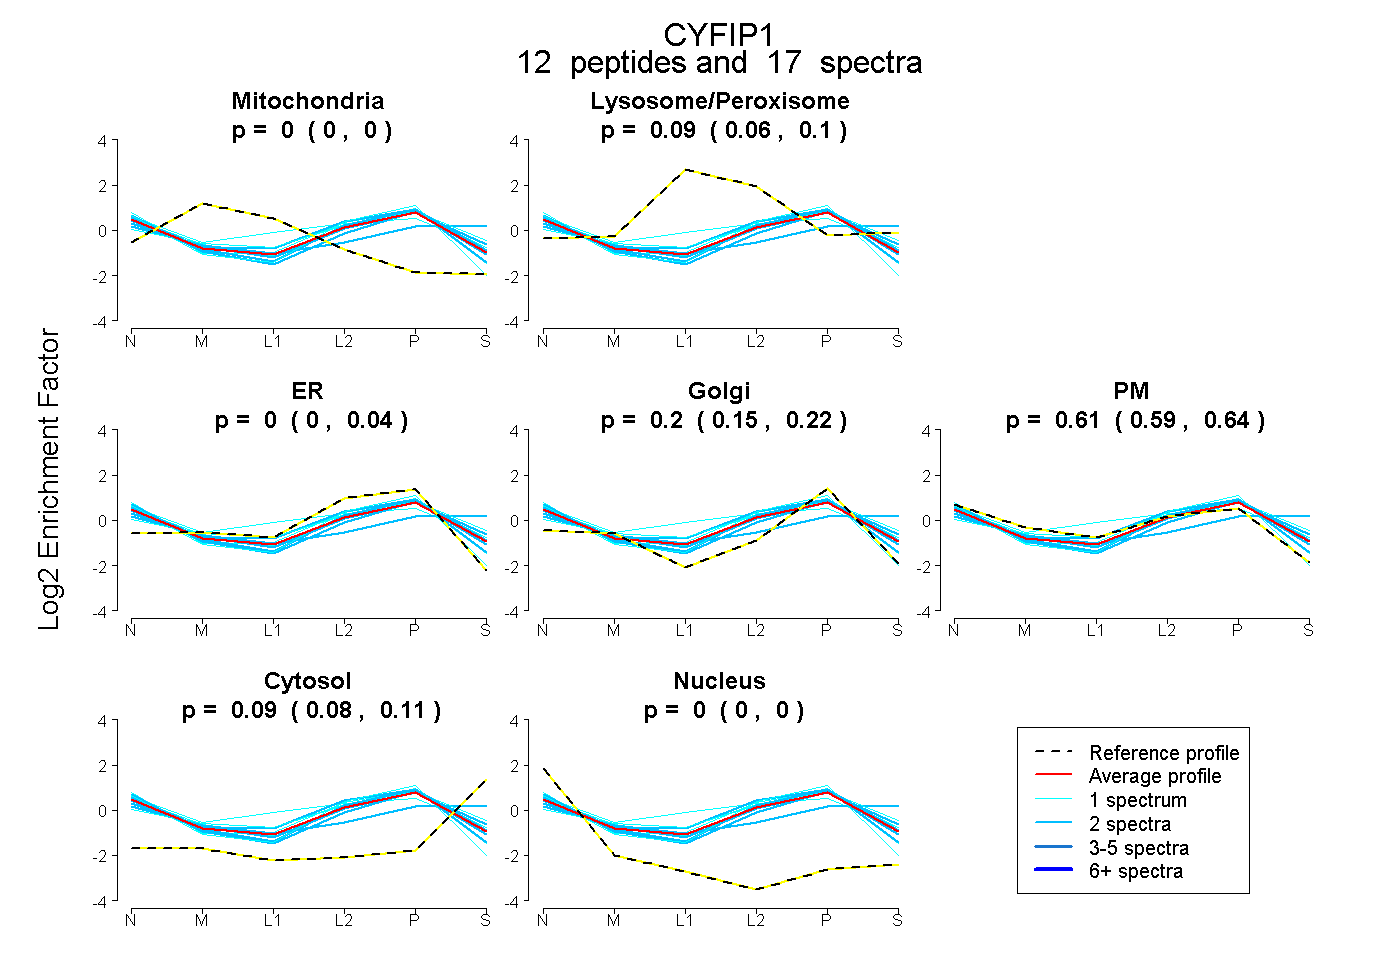
0.000 | 0.000
0.062 | 0.098
0.000 | 0.042
0.150 | 0.218
0.588 | 0.639
0.084 | 0.105
0.000 | 0.000
38peptides
spectra
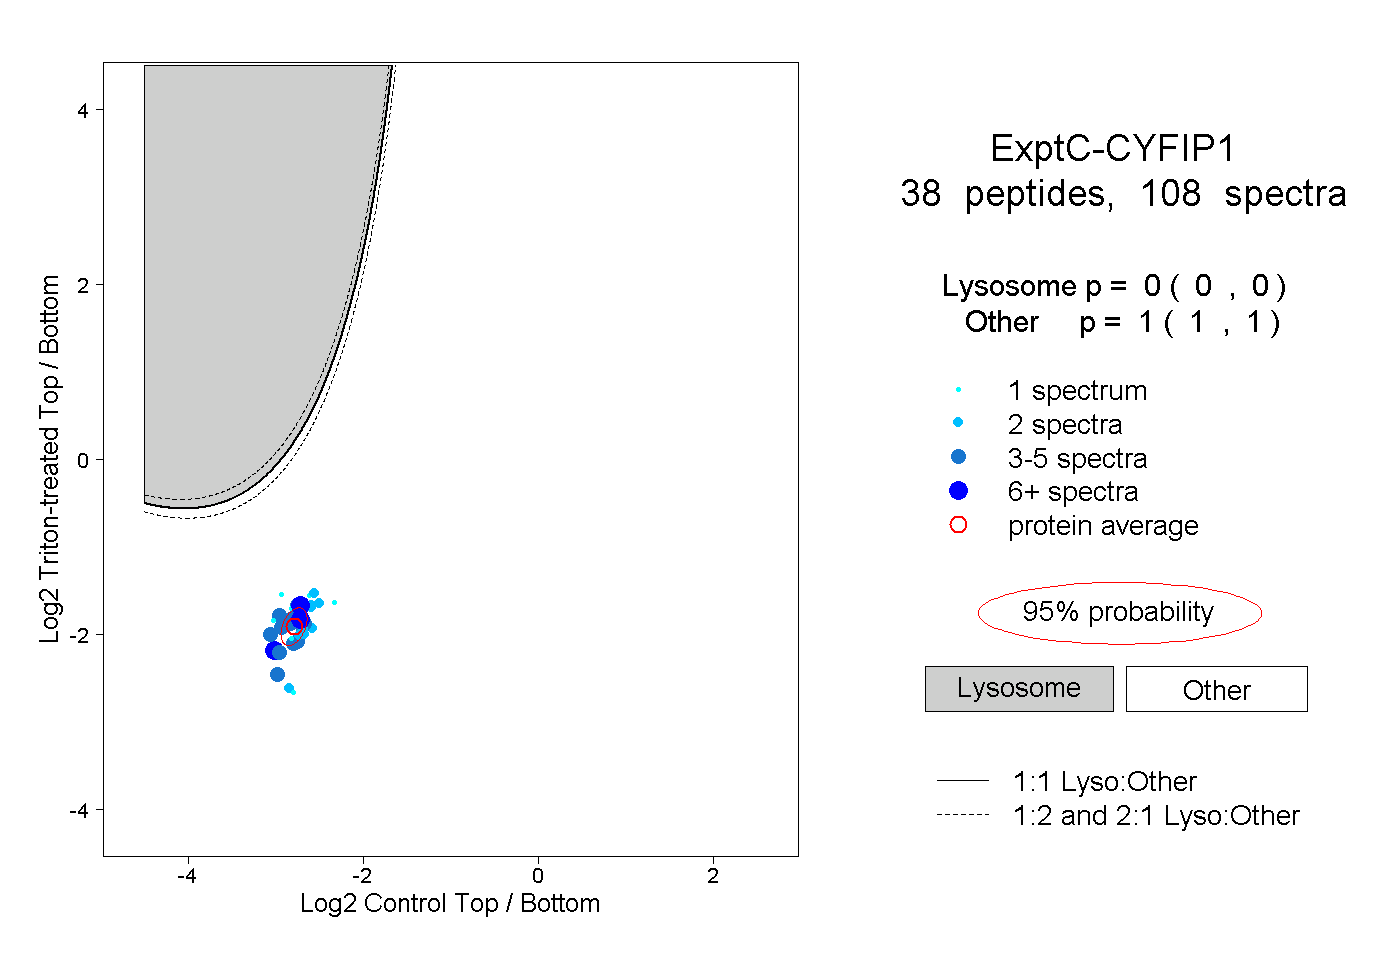
0.000 | 0.000
1.000 | 1.000
15peptides
spectra
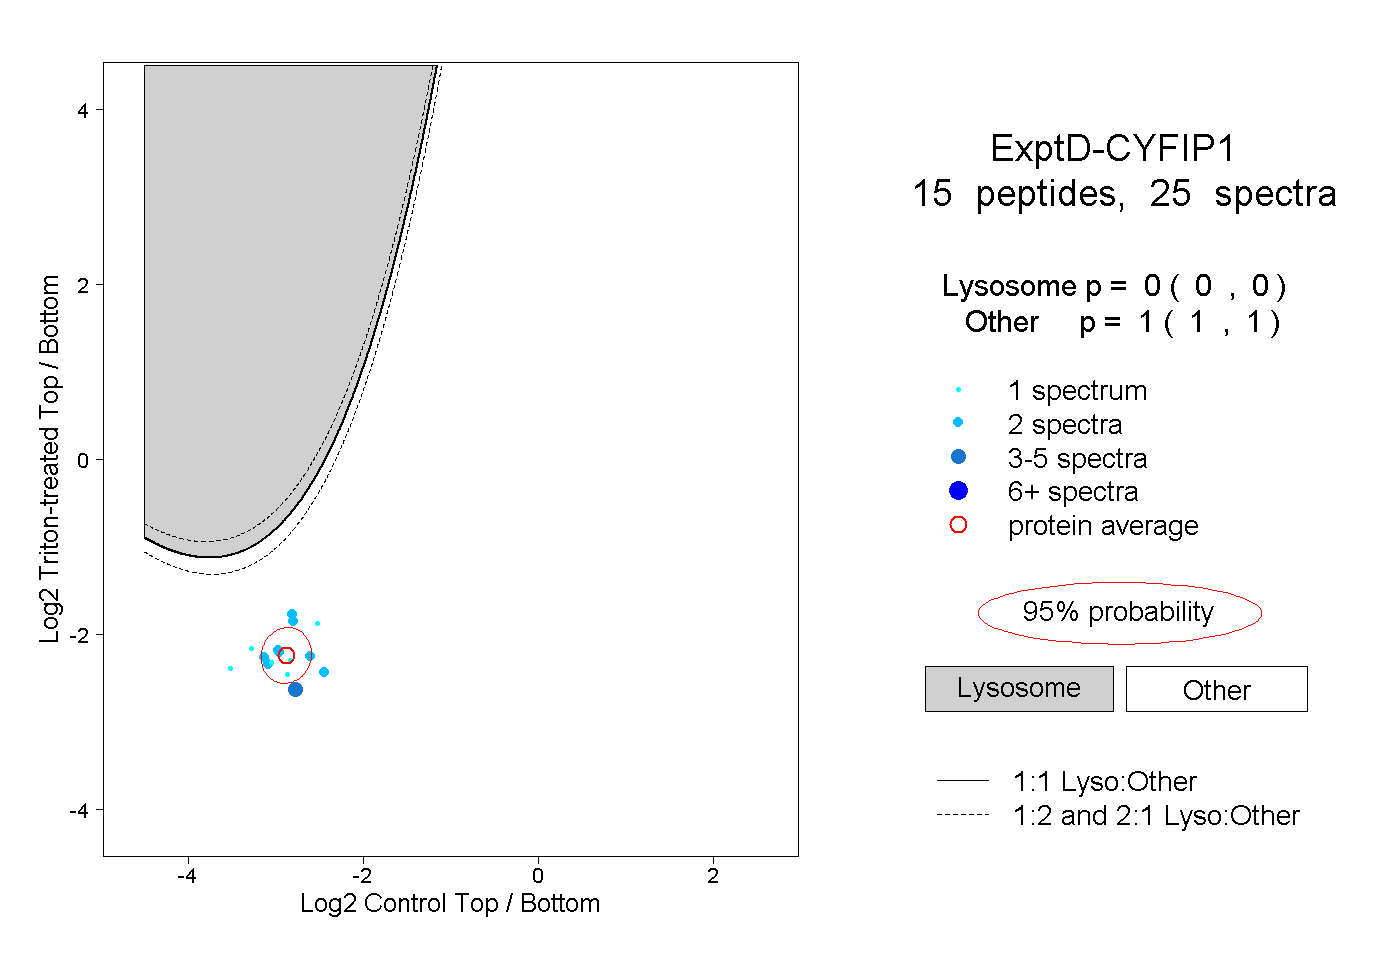
0.000 | 0.000
1.000 | 1.000