CYFIP1
[ENSRNOP00000016376]
Main page
| | | Plot |
Mito |
Lyso |
|
Perox |
ER |
Golgi |
PM |
Cytosol |
Nucleus |
|
| Expt A |
 42
42
peptides |
111
spectra |
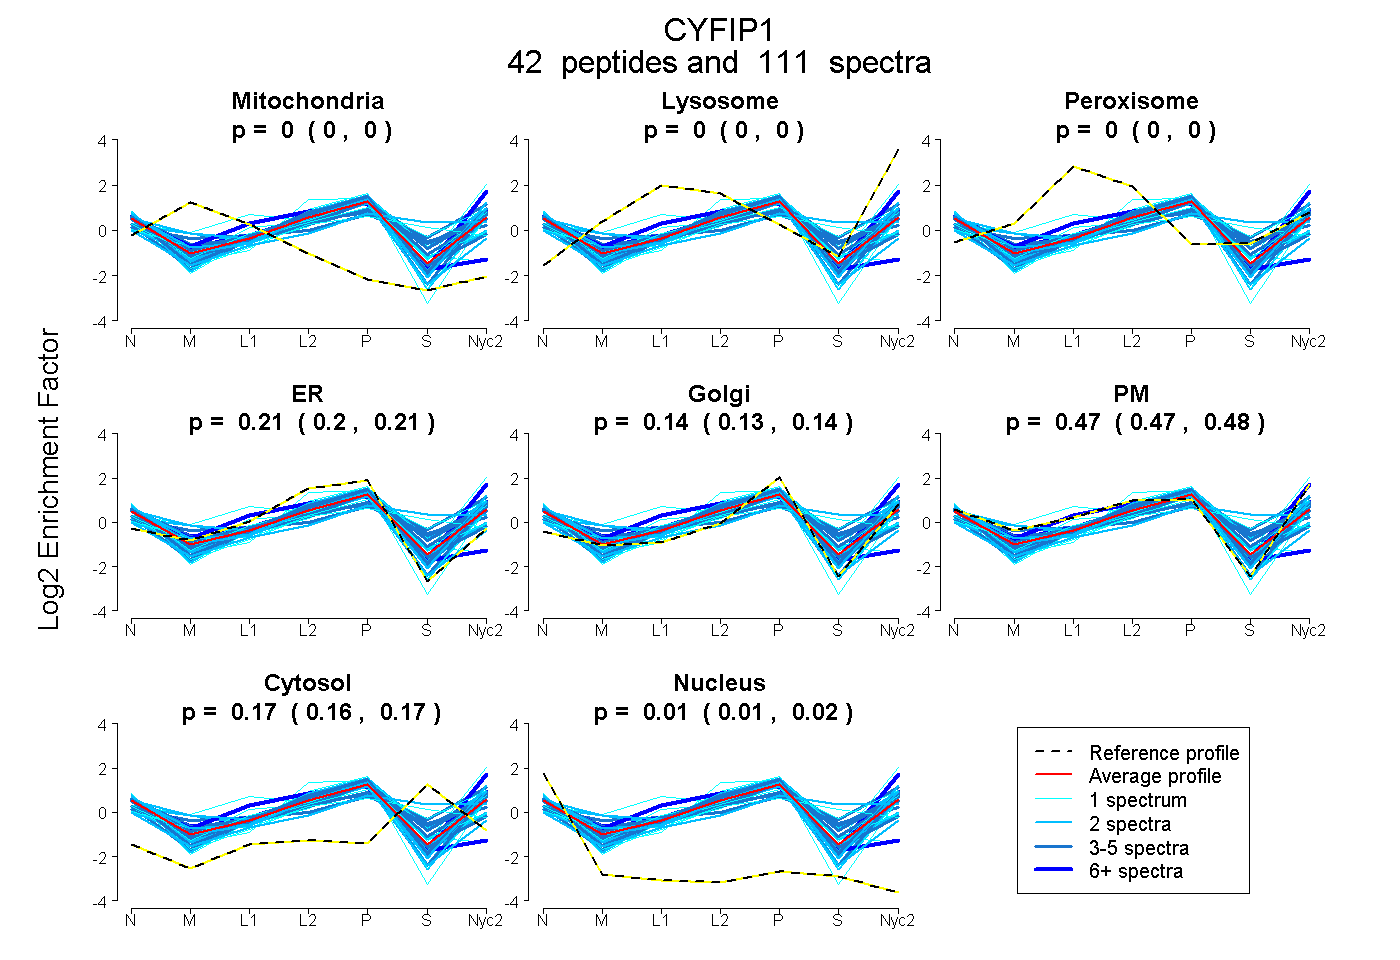 |
0.000
0.000 | 0.000 |
0.000
0.000 | 0.000 |
|
0.000
0.000 | 0.000 |
0.208
0.201 | 0.214 |
0.138
0.133 | 0.143 |
0.474
0.469 | 0.479 |
0.166
0.162 | 0.169 |
0.013
0.011 | 0.015 |
|
| | | Plot |
Mito |
|
Lyso or Perox |
|
ER |
Golgi |
PM |
Cytosol |
Nucleus |
|
| Expt B |
12
peptides |
17
spectra |
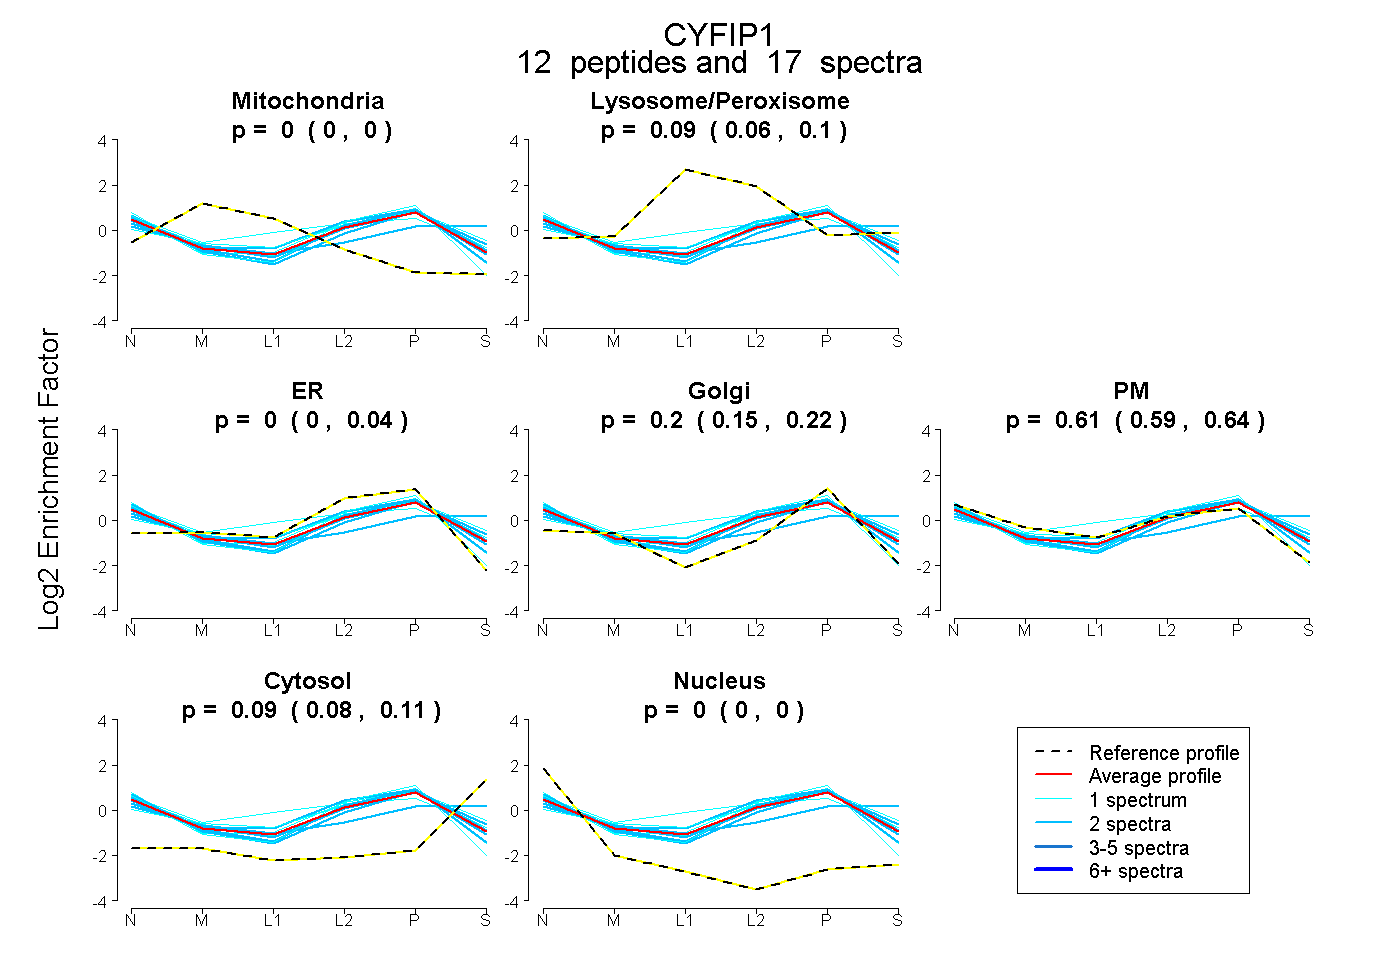 |
0.000
0.000 | 0.000 |
|
0.087
0.062 | 0.098 |
|
0.003
0.000 | 0.042 |
0.200
0.150 | 0.218 |
0.615
0.588 | 0.639 |
0.094
0.084 | 0.105 |
0.000
0.000 | 0.000 |
|
| 2 spectra, NAFVTGIAR |
0.000 |
|
0.066 |
|
0.136 |
0.092 |
0.688 |
0.018 |
0.000 |
|
| 1 spectrum, YAPLHLVPLIER |
0.000 |
|
0.000 |
|
0.310 |
0.154 |
0.490 |
0.000 |
0.046 |
|
| 2 spectra, SSLEGPTILDIEK |
0.000 |
|
0.115 |
|
0.000 |
0.280 |
0.468 |
0.137 |
0.000 |
|
| 2 spectra, SLLQGTILQYVK |
0.000 |
|
0.000 |
|
0.000 |
0.216 |
0.675 |
0.109 |
0.000 |
|
| 1 spectrum, SGFDIK |
0.000 |
|
0.276 |
|
0.000 |
0.411 |
0.204 |
0.108 |
0.000 |
|
| 1 spectrum, EGDLLTK |
0.000 |
|
0.078 |
|
0.000 |
0.149 |
0.648 |
0.126 |
0.000 |
|
| 2 spectra, NFVGPPHFQVICR |
0.000 |
|
0.112 |
|
0.000 |
0.030 |
0.502 |
0.355 |
0.000 |
|
| 1 spectrum, EANHNVSAPYGR |
0.000 |
|
0.240 |
|
0.000 |
0.011 |
0.665 |
0.084 |
0.000 |
|
| 2 spectra, SLELAIGR |
0.000 |
|
0.000 |
|
0.158 |
0.111 |
0.600 |
0.131 |
0.000 |
|
| 1 spectrum, HVQLLGR |
0.000 |
|
0.165 |
|
0.000 |
0.306 |
0.494 |
0.035 |
0.000 |
|
| 1 spectrum, LADQIFAYYK |
0.000 |
|
0.000 |
|
0.124 |
0.010 |
0.826 |
0.040 |
0.000 |
|
| 1 spectrum, AAQFLR |
0.000 |
|
0.046 |
|
0.014 |
0.230 |
0.682 |
0.028 |
0.000 |
|
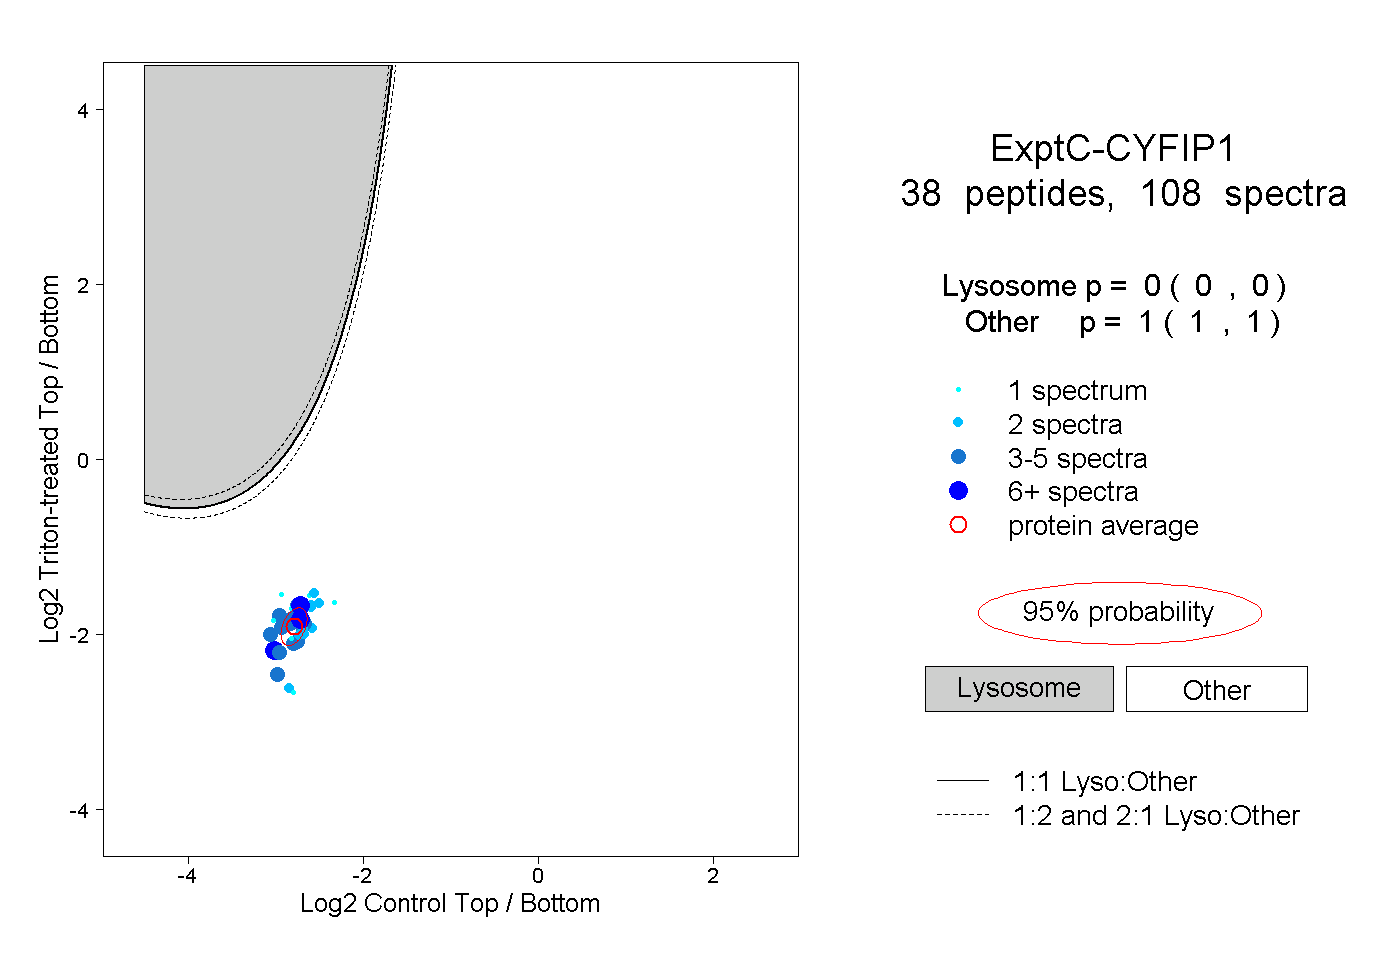
| | | Plot |
|
Lyso |
|
|
|
|
|
|
|
Other |
| Expt C |
38
peptides |
108
spectra |
 |
|
0.000
0.000 | 0.000 |
|
|
|
|
|
|
|
1.000
1.000 | 1.000 |
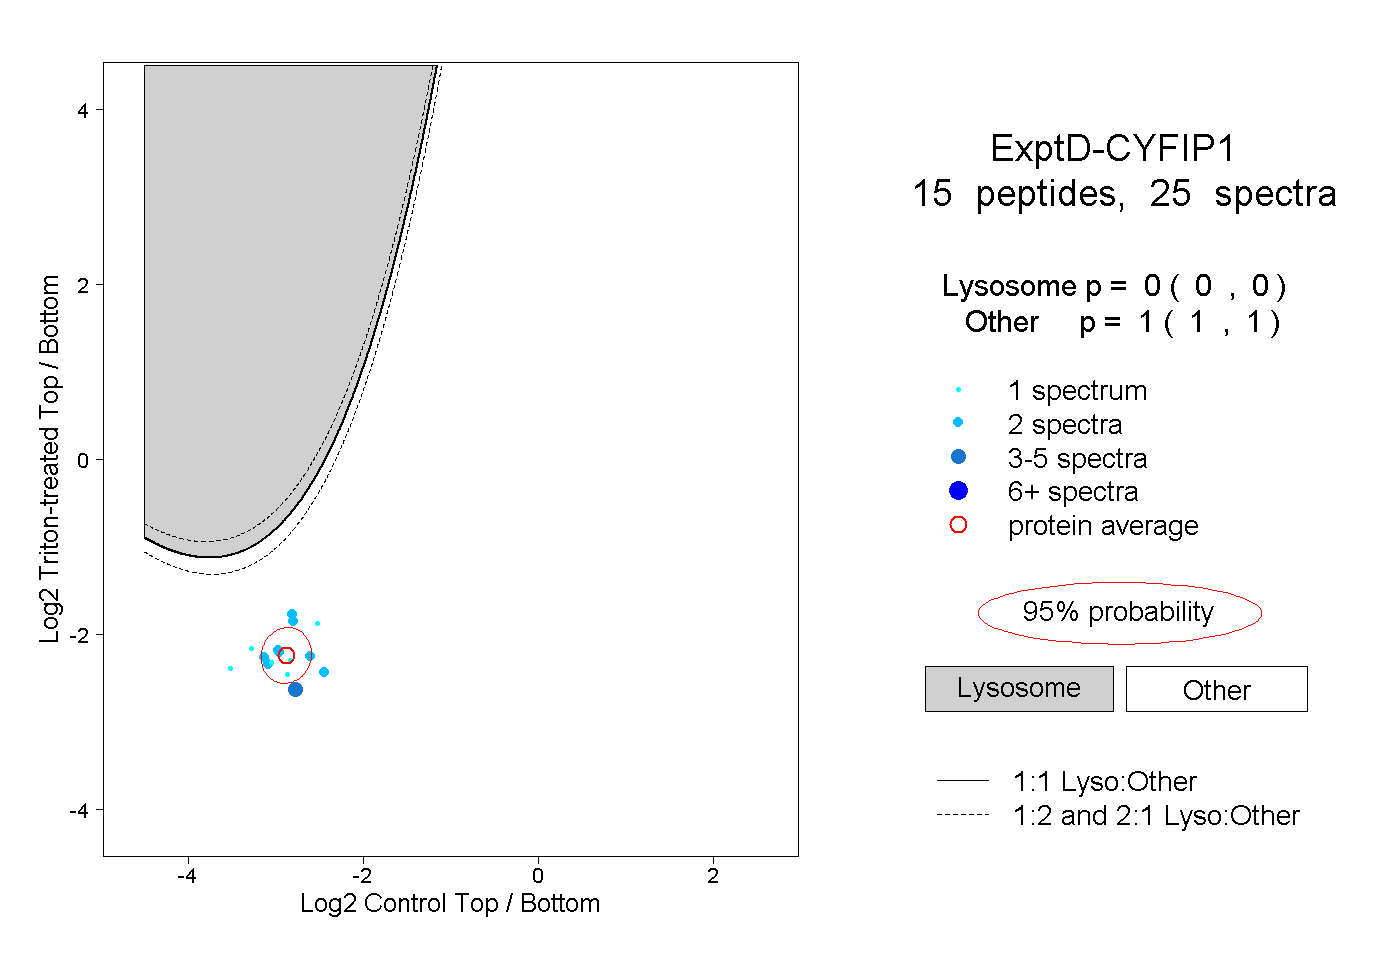
| | | Plot |
|
Lyso |
|
|
|
|
|
|
|
Other |
| Expt D |
15
peptides |
25
spectra |
 |
|
0.000
0.000 | 0.000 |
|
|
|
|
|
|
|
1.000
1.000 | 1.000 |