 42
42peptides
spectra
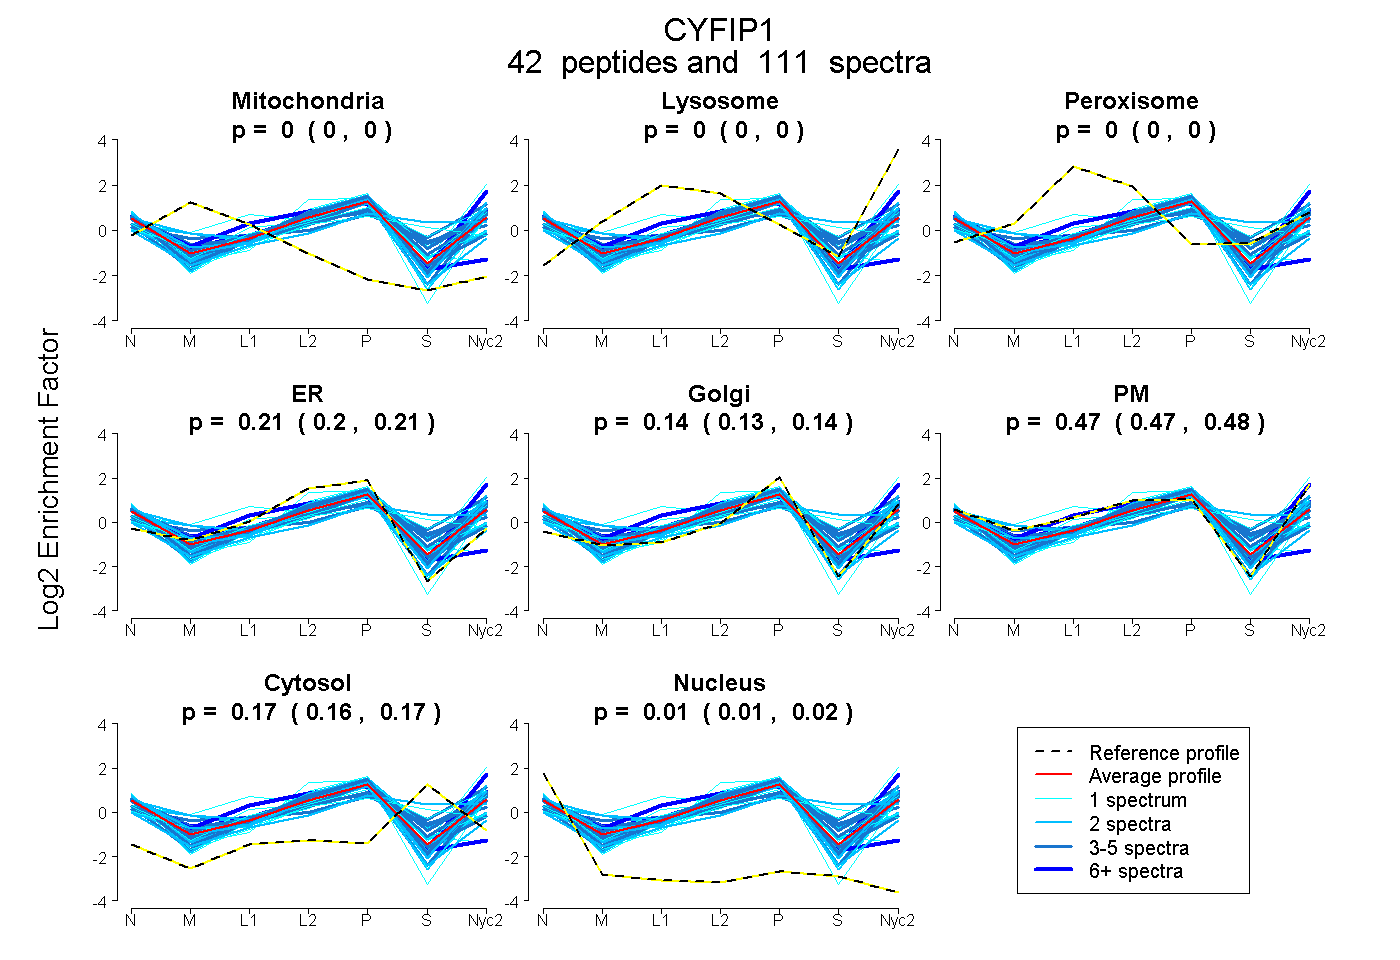
0.000 | 0.000
0.000 | 0.000
0.000 | 0.000
0.201 | 0.214
0.133 | 0.143
0.469 | 0.479
0.162 | 0.169
0.011 | 0.015
| Plot | Mito | Lyso | Perox | ER | Golgi | PM | Cytosol | Nucleus | |||||
| Expt A |
42 peptides |
111 spectra |
|
0.000 0.000 | 0.000 |
0.000 0.000 | 0.000 |
0.000 0.000 | 0.000 |
0.208 0.201 | 0.214 |
0.138 0.133 | 0.143 |
0.474 0.469 | 0.479 |
0.166 0.162 | 0.169 |
0.013 0.011 | 0.015 |
| 2 spectra, YSNSEVVTGSGR | 0.000 | 0.000 | 0.000 | 0.041 | 0.306 | 0.564 | 0.029 | 0.060 | ||
| 6 spectra, NAFVTGIAR | 0.000 | 0.065 | 0.006 | 0.000 | 0.032 | 0.820 | 0.077 | 0.000 | ||
| 2 spectra, TVCFQNLR | 0.154 | 0.000 | 0.000 | 0.421 | 0.143 | 0.220 | 0.000 | 0.062 | ||
| 2 spectra, YETLLK | 0.000 | 0.000 | 0.000 | 0.034 | 0.222 | 0.687 | 0.031 | 0.026 | ||
| 1 spectrum, SGFDIK | 0.000 | 0.000 | 0.000 | 0.263 | 0.221 | 0.444 | 0.000 | 0.073 | ||
| 3 spectra, DFVSEAYLITLGK | 0.000 | 0.000 | 0.000 | 0.343 | 0.048 | 0.280 | 0.329 | 0.000 | ||
| 2 spectra, SIDLNR | 0.000 | 0.000 | 0.000 | 0.123 | 0.226 | 0.527 | 0.086 | 0.038 | ||
| 1 spectrum, CNEQPNR | 0.000 | 0.000 | 0.000 | 0.256 | 0.265 | 0.380 | 0.082 | 0.017 | ||
| 1 spectrum, VEIYEK | 0.000 | 0.022 | 0.014 | 0.000 | 0.074 | 0.570 | 0.320 | 0.000 | ||
| 2 spectra, FISELAR | 0.000 | 0.000 | 0.000 | 0.113 | 0.225 | 0.591 | 0.027 | 0.044 | ||
| 2 spectra, DIVEYAELK | 0.000 | 0.000 | 0.000 | 0.197 | 0.213 | 0.479 | 0.043 | 0.068 | ||
| 1 spectrum, VMAGSLLLDK | 0.000 | 0.000 | 0.062 | 0.251 | 0.000 | 0.241 | 0.447 | 0.000 | ||
| 1 spectrum, LADQIFAYYK | 0.000 | 0.000 | 0.000 | 0.118 | 0.115 | 0.586 | 0.181 | 0.000 | ||
| 5 spectra, SGDGESTPVEHVR | 0.000 | 0.000 | 0.005 | 0.061 | 0.000 | 0.611 | 0.323 | 0.000 | ||
| 1 spectrum, DCPDNAEEYER | 0.000 | 0.000 | 0.000 | 0.000 | 0.151 | 0.740 | 0.109 | 0.000 | ||
| 3 spectra, TVEVLEPEVTK | 0.000 | 0.000 | 0.000 | 0.168 | 0.199 | 0.401 | 0.233 | 0.000 | ||
| 2 spectra, YNYTTEEK | 0.000 | 0.000 | 0.021 | 0.000 | 0.158 | 0.331 | 0.489 | 0.000 | ||
| 3 spectra, TFLDDPIWR | 0.000 | 0.000 | 0.000 | 0.168 | 0.271 | 0.479 | 0.047 | 0.035 | ||
| 1 spectrum, MADPQSIQESQNLSMFLANHNK | 0.000 | 0.000 | 0.170 | 0.076 | 0.405 | 0.169 | 0.181 | 0.000 | ||
| 3 spectra, YLTLDSFDAMFR | 0.000 | 0.000 | 0.000 | 0.146 | 0.198 | 0.563 | 0.081 | 0.013 | ||
| 4 spectra, TVCDWETGHEPFNDPALR | 0.000 | 0.000 | 0.002 | 0.500 | 0.000 | 0.301 | 0.130 | 0.066 | ||
| 2 spectra, NVIQSVLQAIR | 0.000 | 0.000 | 0.000 | 0.301 | 0.209 | 0.423 | 0.000 | 0.067 | ||
| 2 spectra, AAQFLR | 0.000 | 0.000 | 0.000 | 0.162 | 0.221 | 0.561 | 0.000 | 0.056 | ||
| 2 spectra, LCHAER | 0.106 | 0.000 | 0.000 | 0.375 | 0.206 | 0.235 | 0.079 | 0.000 | ||
| 1 spectrum, FAVLDFCYHLLK | 0.000 | 0.000 | 0.000 | 0.673 | 0.000 | 0.000 | 0.205 | 0.122 | ||
| 1 spectrum, YAPLHLVPLIER | 0.000 | 0.000 | 0.000 | 0.117 | 0.147 | 0.550 | 0.186 | 0.000 | ||
| 4 spectra, TVLPFSQEFQR | 0.000 | 0.000 | 0.022 | 0.041 | 0.265 | 0.430 | 0.241 | 0.000 | ||
| 5 spectra, FINMFAVLDELK | 0.000 | 0.000 | 0.000 | 0.146 | 0.094 | 0.598 | 0.161 | 0.000 | ||
| 1 spectrum, HEYGSPGILEFFHHQLK | 0.107 | 0.000 | 0.000 | 0.329 | 0.037 | 0.527 | 0.000 | 0.000 | ||
| 1 spectrum, SLLQGTILQYVK | 0.000 | 0.000 | 0.000 | 0.269 | 0.150 | 0.287 | 0.199 | 0.095 | ||
| 2 spectra, SSLEGPTILDIEK | 0.000 | 0.000 | 0.000 | 0.023 | 0.295 | 0.531 | 0.131 | 0.020 | ||
| 3 spectra, TSAHYEENK | 0.000 | 0.000 | 0.000 | 0.108 | 0.026 | 0.534 | 0.332 | 0.000 | ||
| 2 spectra, LCCGLSMFEVILTR | 0.000 | 0.000 | 0.000 | 0.481 | 0.000 | 0.281 | 0.211 | 0.027 | ||
| 4 spectra, AVGPSSTQLYMVR | 0.000 | 0.109 | 0.000 | 0.000 | 0.022 | 0.543 | 0.325 | 0.000 | ||
| 6 spectra, NFVGPPHFQVICR | 0.000 | 0.000 | 0.022 | 0.761 | 0.000 | 0.000 | 0.068 | 0.149 | ||
| 9 spectra, GLQVLMGR | 0.000 | 0.000 | 0.000 | 0.117 | 0.180 | 0.603 | 0.090 | 0.010 | ||
| 2 spectra, LMNFMYFQR | 0.000 | 0.031 | 0.071 | 0.014 | 0.392 | 0.307 | 0.186 | 0.000 | ||
| 3 spectra, LGTPQQIAIAR | 0.000 | 0.000 | 0.000 | 0.159 | 0.170 | 0.594 | 0.000 | 0.077 | ||
| 2 spectra, AIPQVK | 0.000 | 0.000 | 0.000 | 0.151 | 0.215 | 0.465 | 0.144 | 0.025 | ||
| 2 spectra, EANHNVSAPYGR | 0.000 | 0.000 | 0.000 | 0.392 | 0.000 | 0.329 | 0.209 | 0.071 | ||
| 2 spectra, SLELAIGR | 0.000 | 0.000 | 0.000 | 0.244 | 0.221 | 0.394 | 0.140 | 0.001 | ||
| 7 spectra, HVQLLGR | 0.000 | 0.000 | 0.000 | 0.161 | 0.080 | 0.616 | 0.129 | 0.013 |
| Plot | Mito | Lyso or Perox | ER | Golgi | PM | Cytosol | Nucleus | ||||||
| Expt B |
12 peptides |
17 spectra |
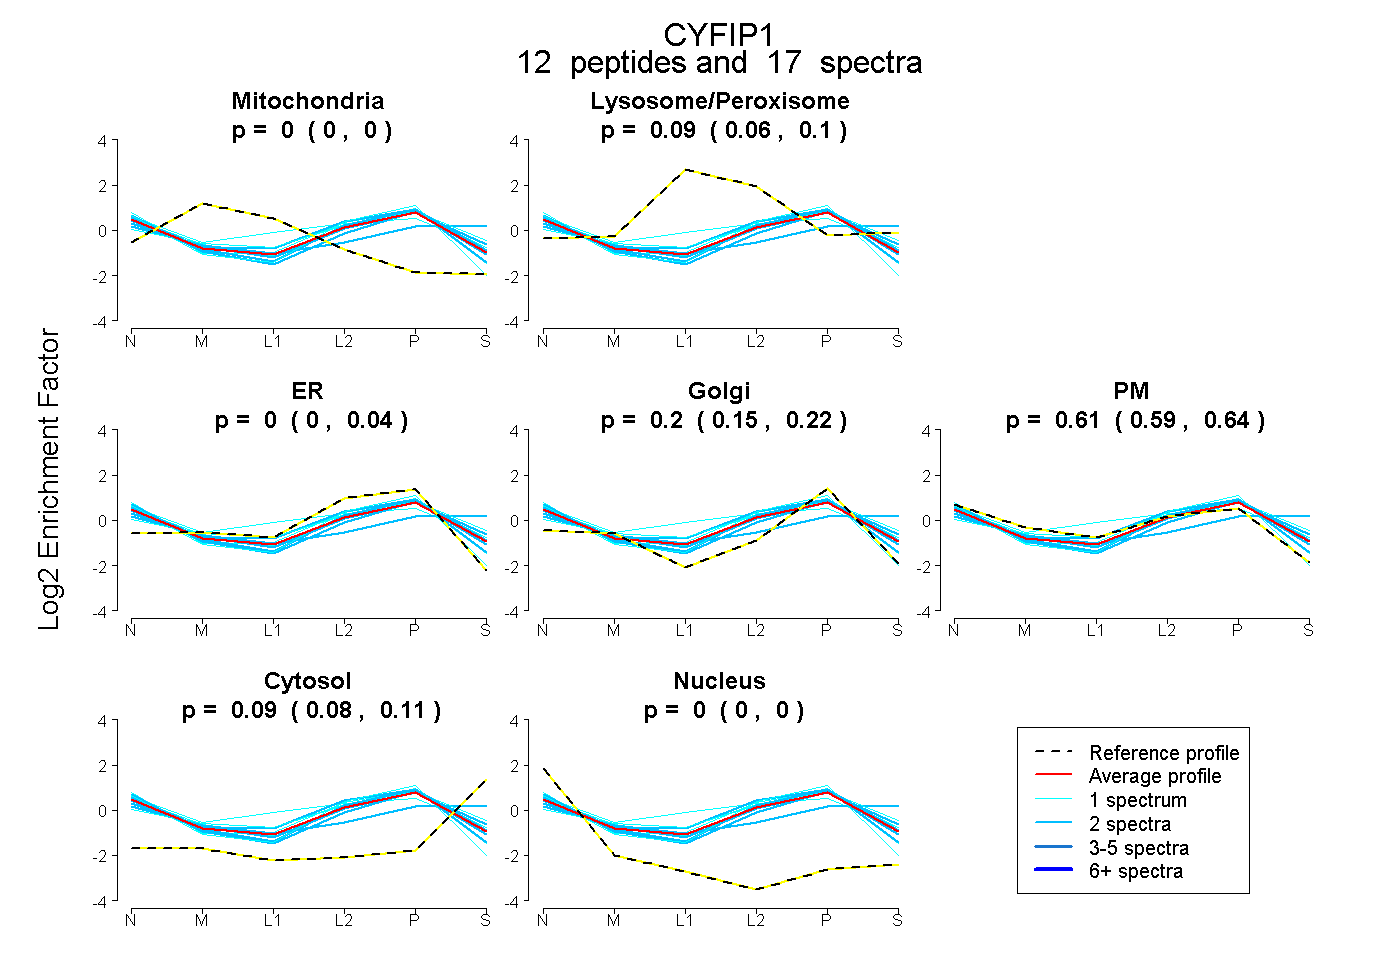 |
0.000 0.000 | 0.000 |
0.087 0.062 | 0.098 |
0.003 0.000 | 0.042 |
0.200 0.150 | 0.218 |
0.615 0.588 | 0.639 |
0.094 0.084 | 0.105 |
0.000 0.000 | 0.000 |
|||
| Plot | Lyso | Other | |||||||||||
| Expt C |
38 peptides |
108 spectra |
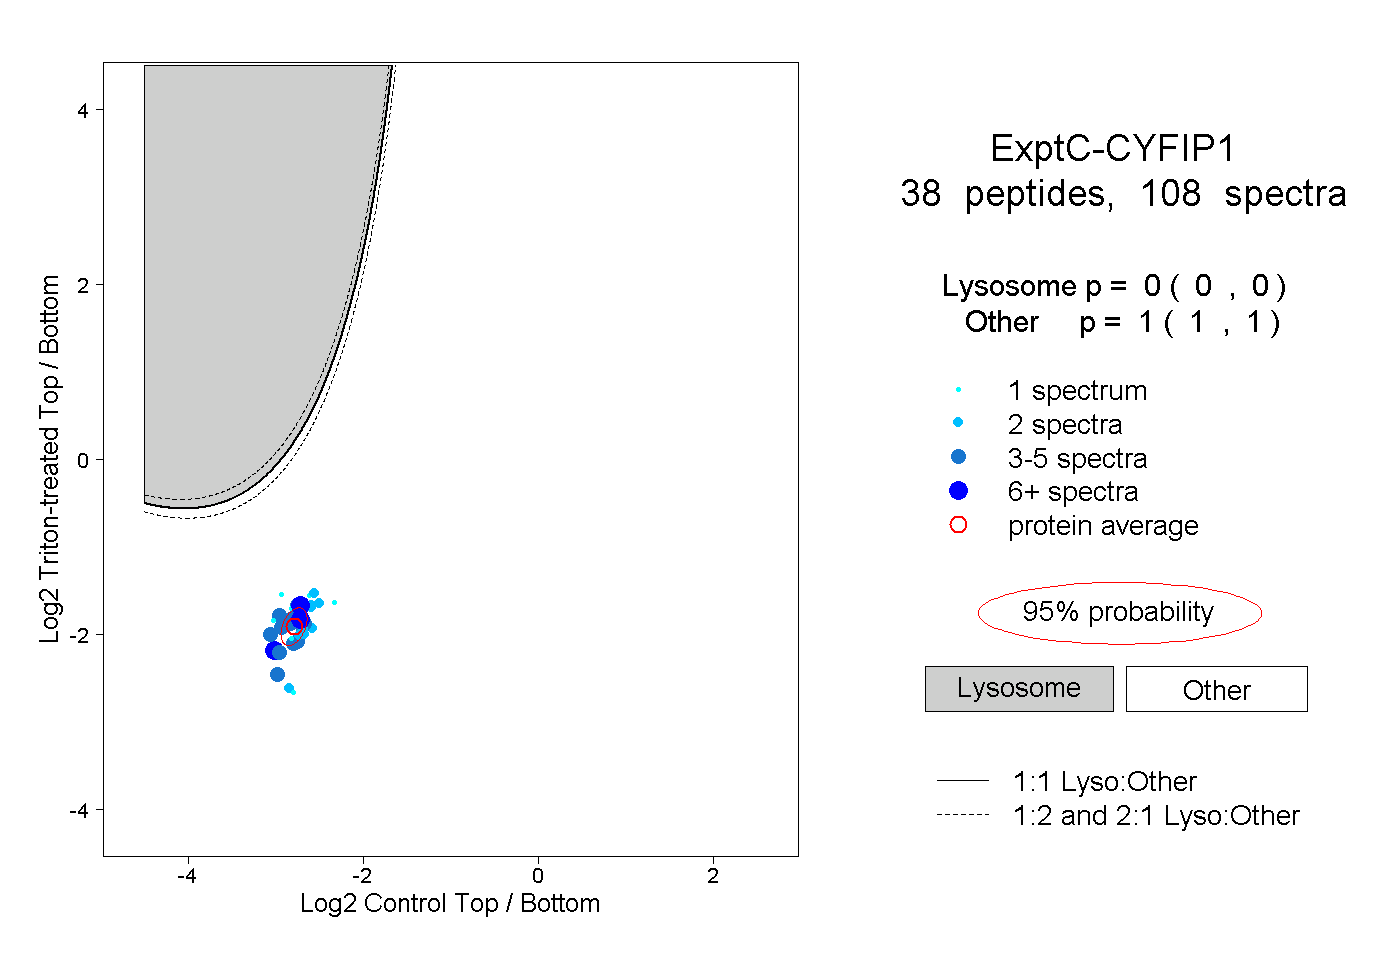 |
0.000 0.000 | 0.000 |
1.000 1.000 | 1.000 |
||||||||
| Plot | Lyso | Other | |||||||||||
| Expt D |
15 peptides |
25 spectra |
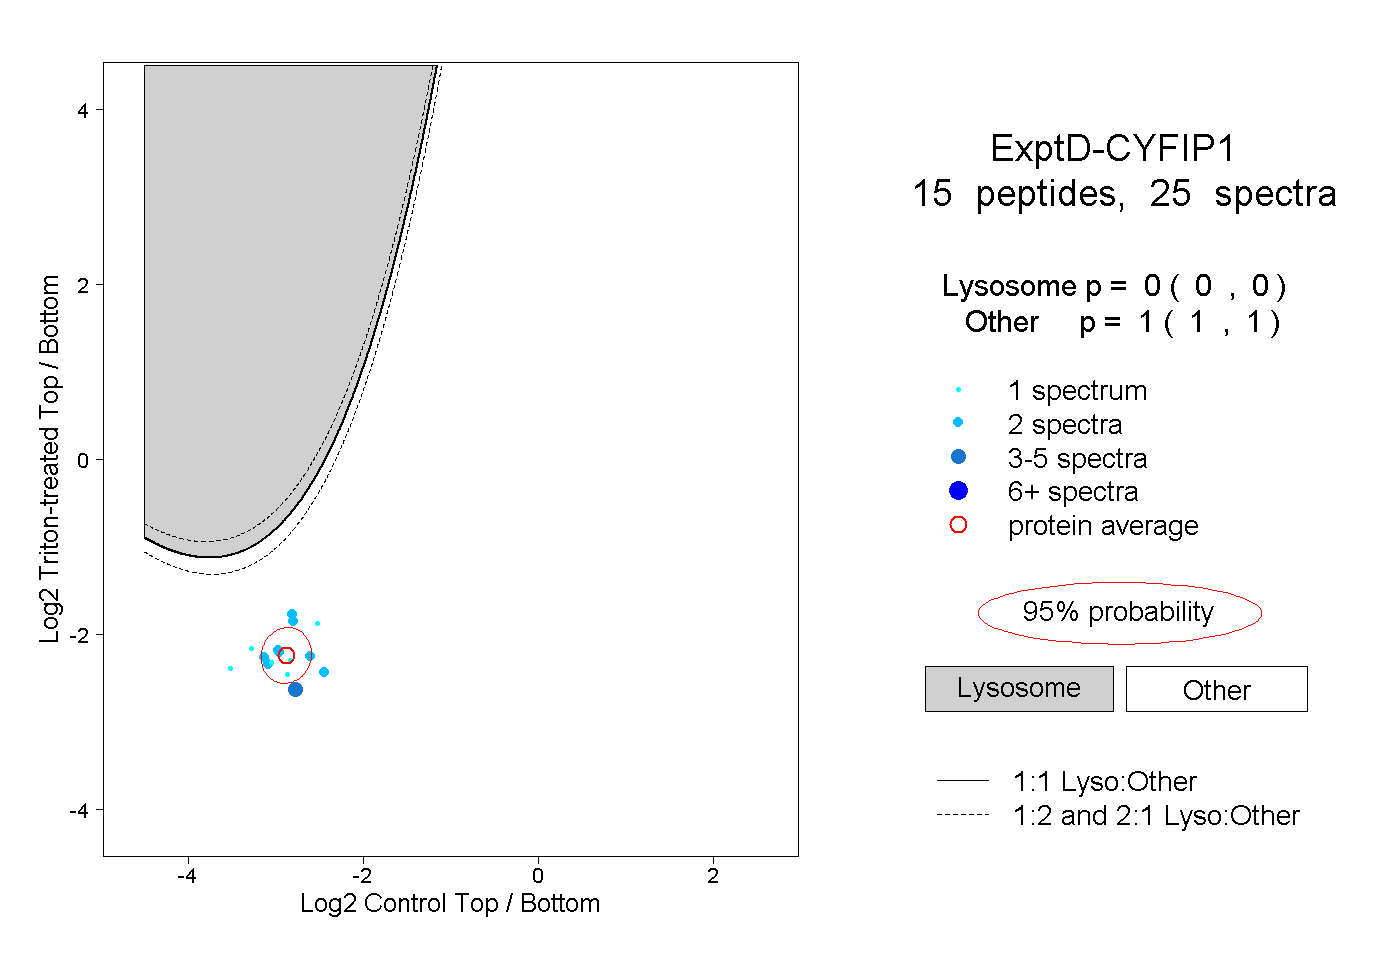 |
0.000 0.000 | 0.000 |
1.000 1.000 | 1.000 |