 2
2peptides
spectra
0.000 | 0.160
0.128 | 0.276
0.000 | 0.237
0.000 | 0.000
0.000 | 0.000
0.351 | 0.677
0.000 | 0.182
0.000 | 0.054
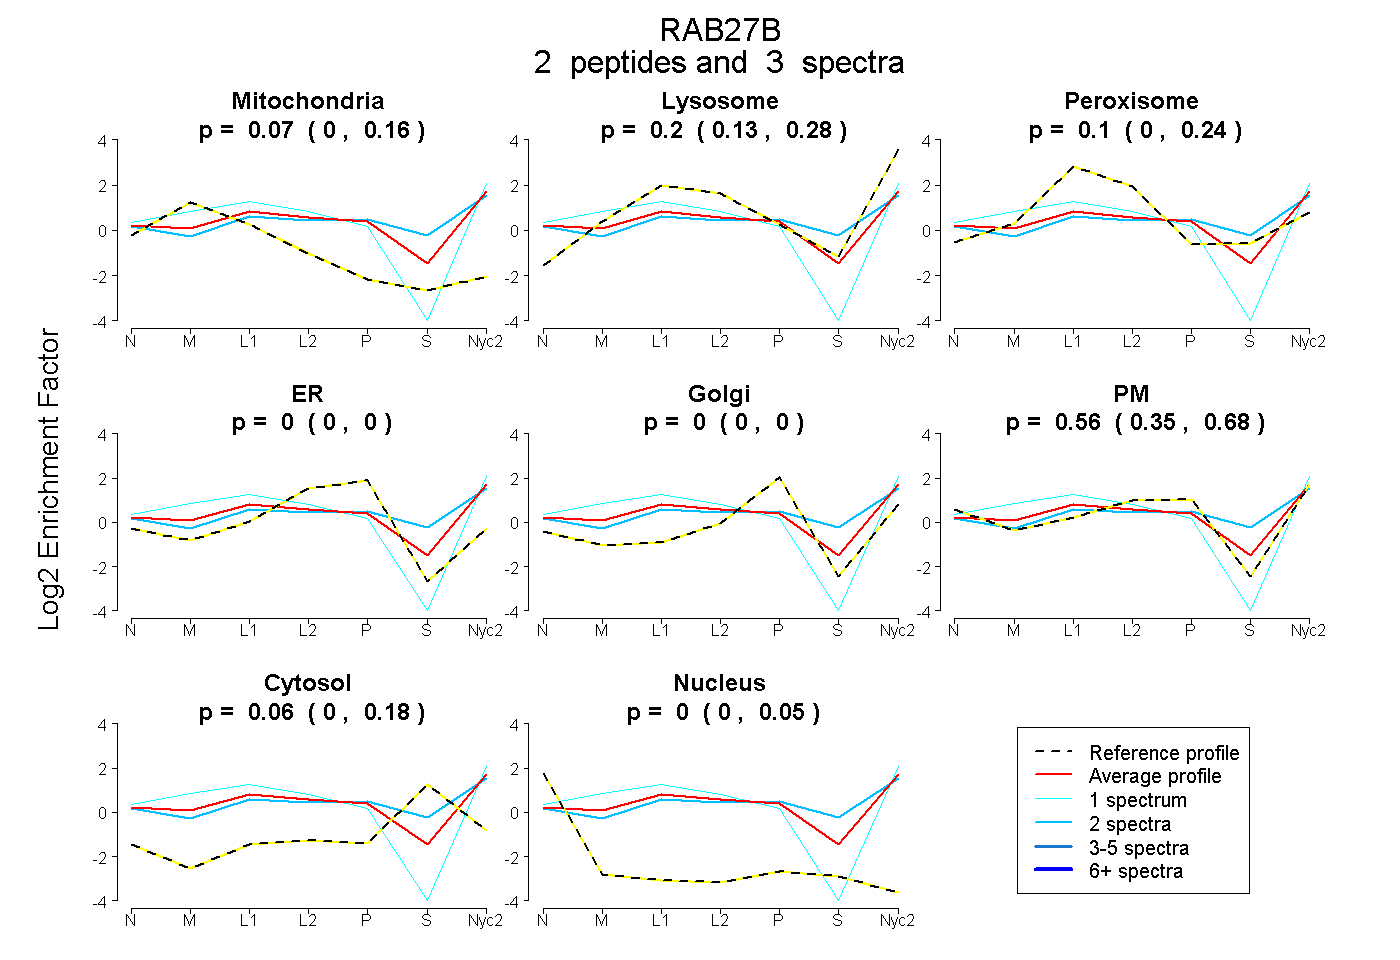
| Plot | Mito | Lyso | Perox | ER | Golgi | PM | Cytosol | Nucleus | |||||
| Expt A |
2 peptides |
3 spectra |
|
0.075 0.000 | 0.160 |
0.203 0.128 | 0.276 |
0.101 0.000 | 0.237 |
0.000 0.000 | 0.000 |
0.000 0.000 | 0.000 |
0.561 0.351 | 0.677 |
0.061 0.000 | 0.182 |
0.000 0.000 | 0.054 |
| 2 spectra, SLTTAFFR | 0.000 | 0.187 | 0.158 | 0.000 | 0.000 | 0.419 | 0.236 | 0.000 | ||
| 1 spectrum, SVETLLDLIMK | 0.153 | 0.208 | 0.000 | 0.000 | 0.000 | 0.639 | 0.000 | 0.000 |
| Plot | Mito | Lyso or Perox | ER | Golgi | PM | Cytosol | Nucleus | ||||||
| Expt B |
1 peptide |
2 spectra |
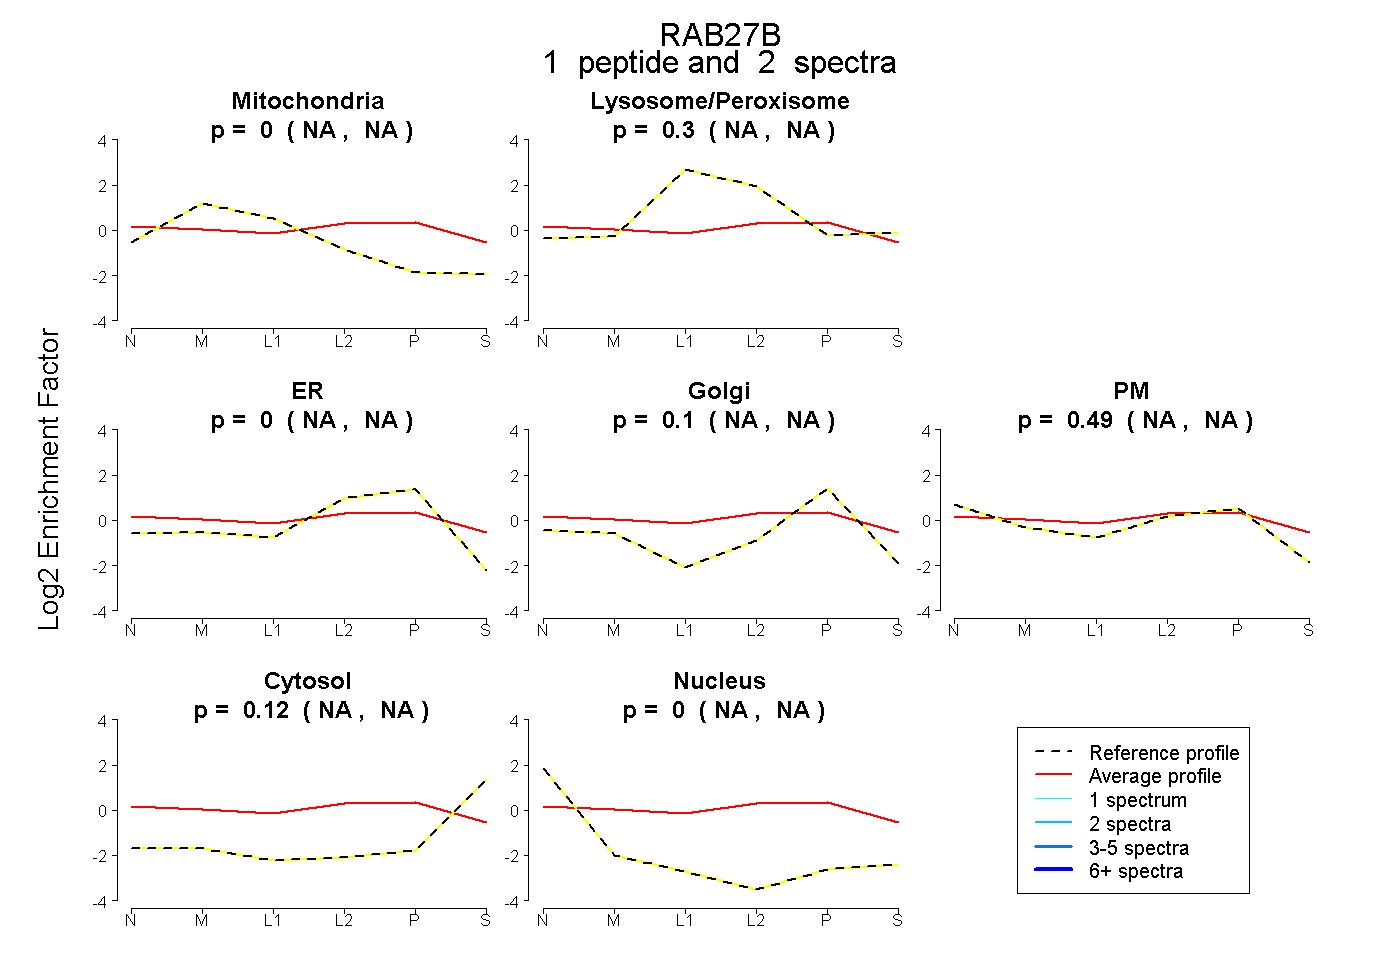 |
0.000 NA | NA |
0.298 NA | NA |
0.000 NA | NA |
0.099 NA | NA |
0.487 NA | NA |
0.116 NA | NA |
0.000 NA | NA |
|||
| Plot | Lyso | Other | |||||||||||
| Expt C |
2 peptides |
3 spectra |
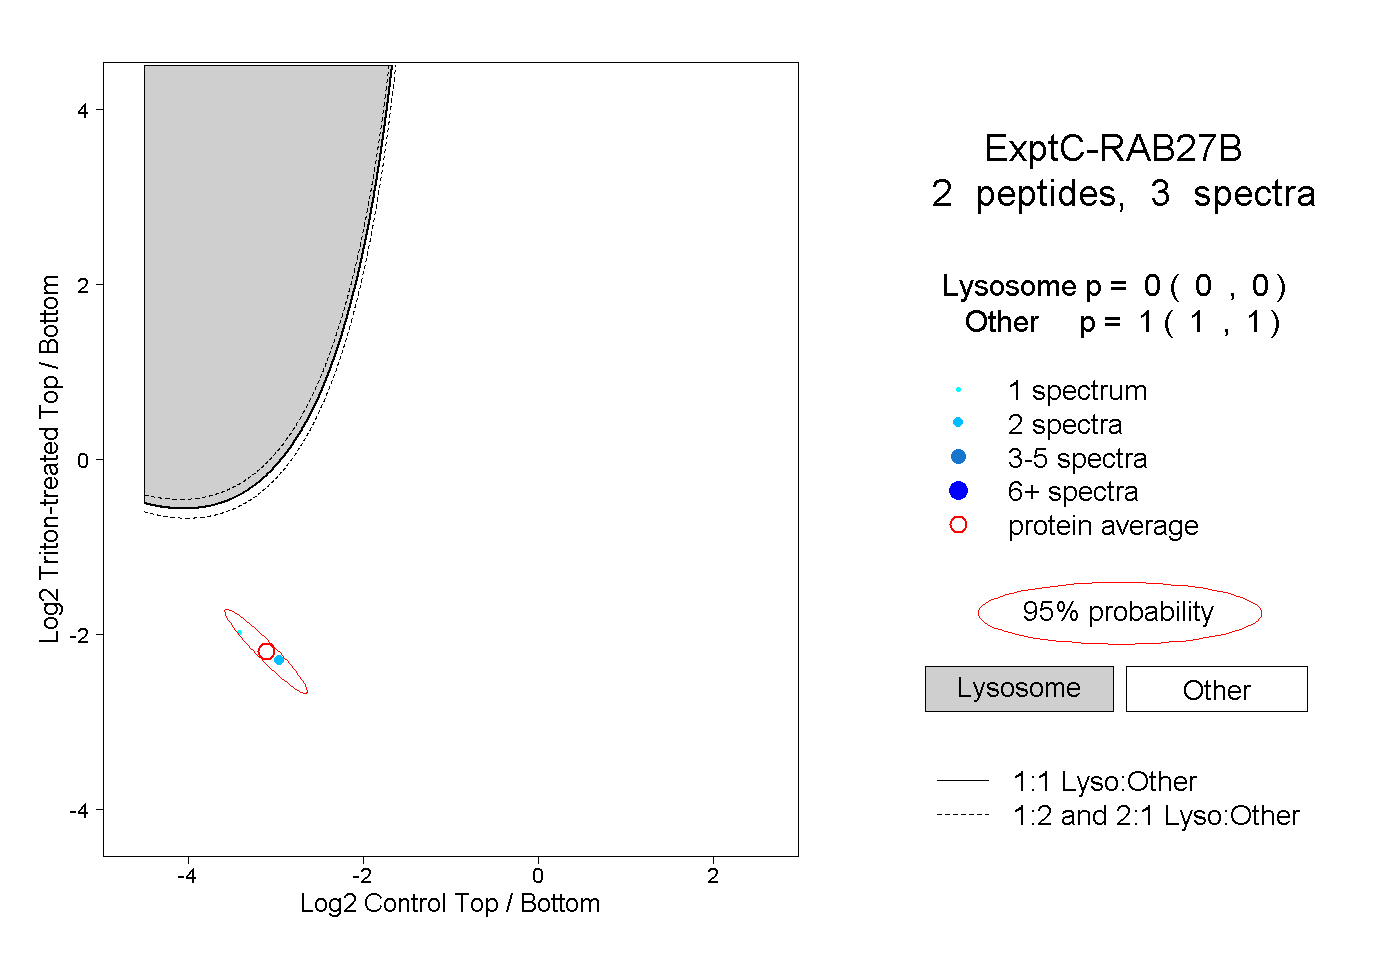 |
0.000 0.000 | 0.000 |
1.000 1.000 | 1.000 |