7
7peptides
spectra
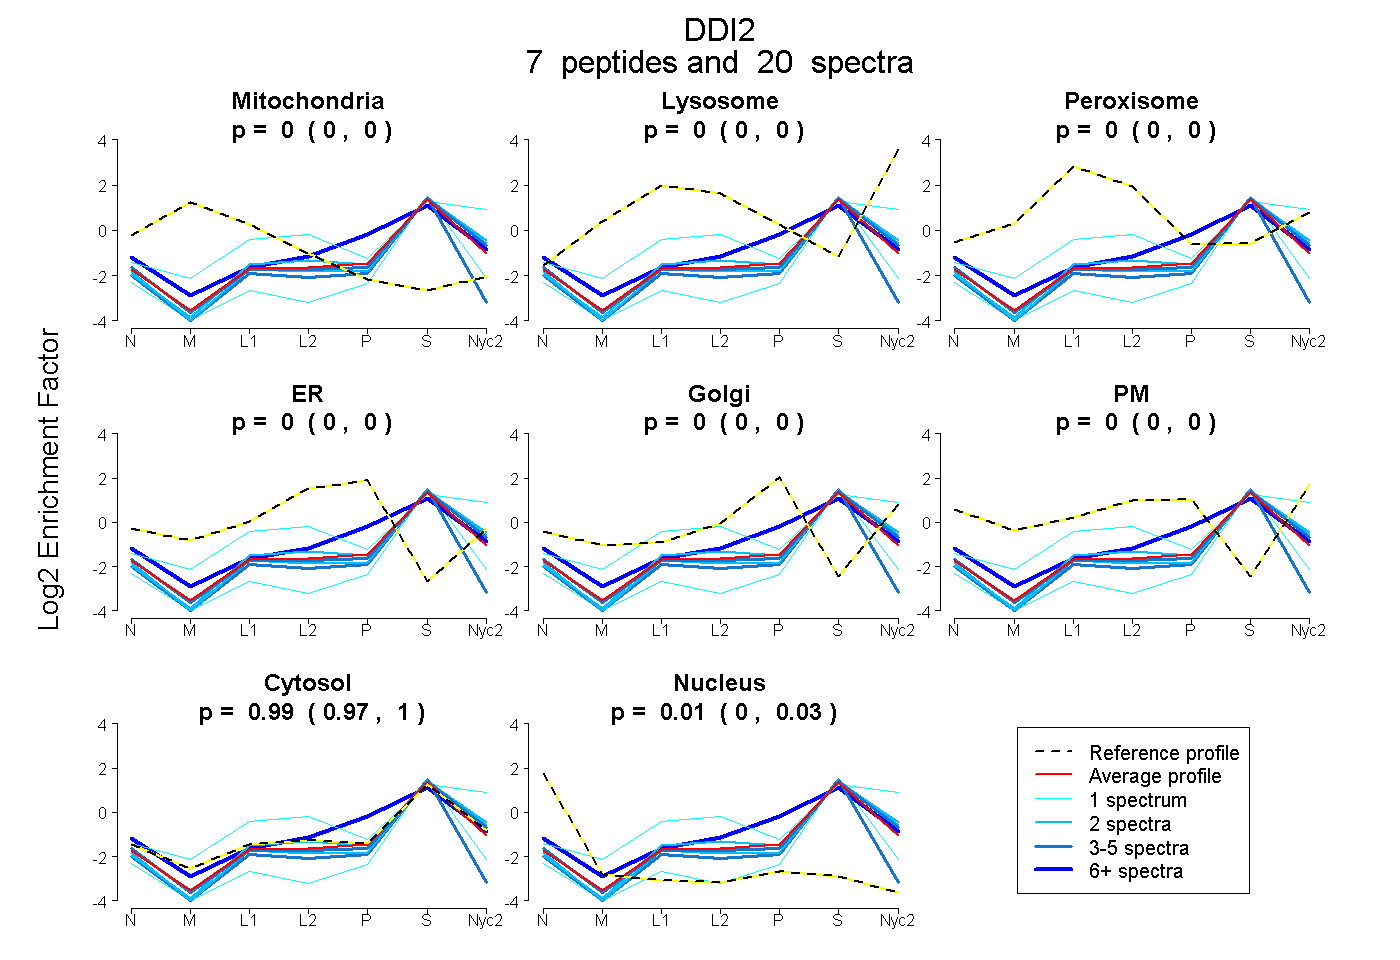
0.000 | 0.000
0.000 | 0.000
0.000 | 0.000
0.000 | 0.000
0.000 | 0.000
0.000 | 0.000
0.971 | 1.000
0.000 | 0.026
7peptides
spectra
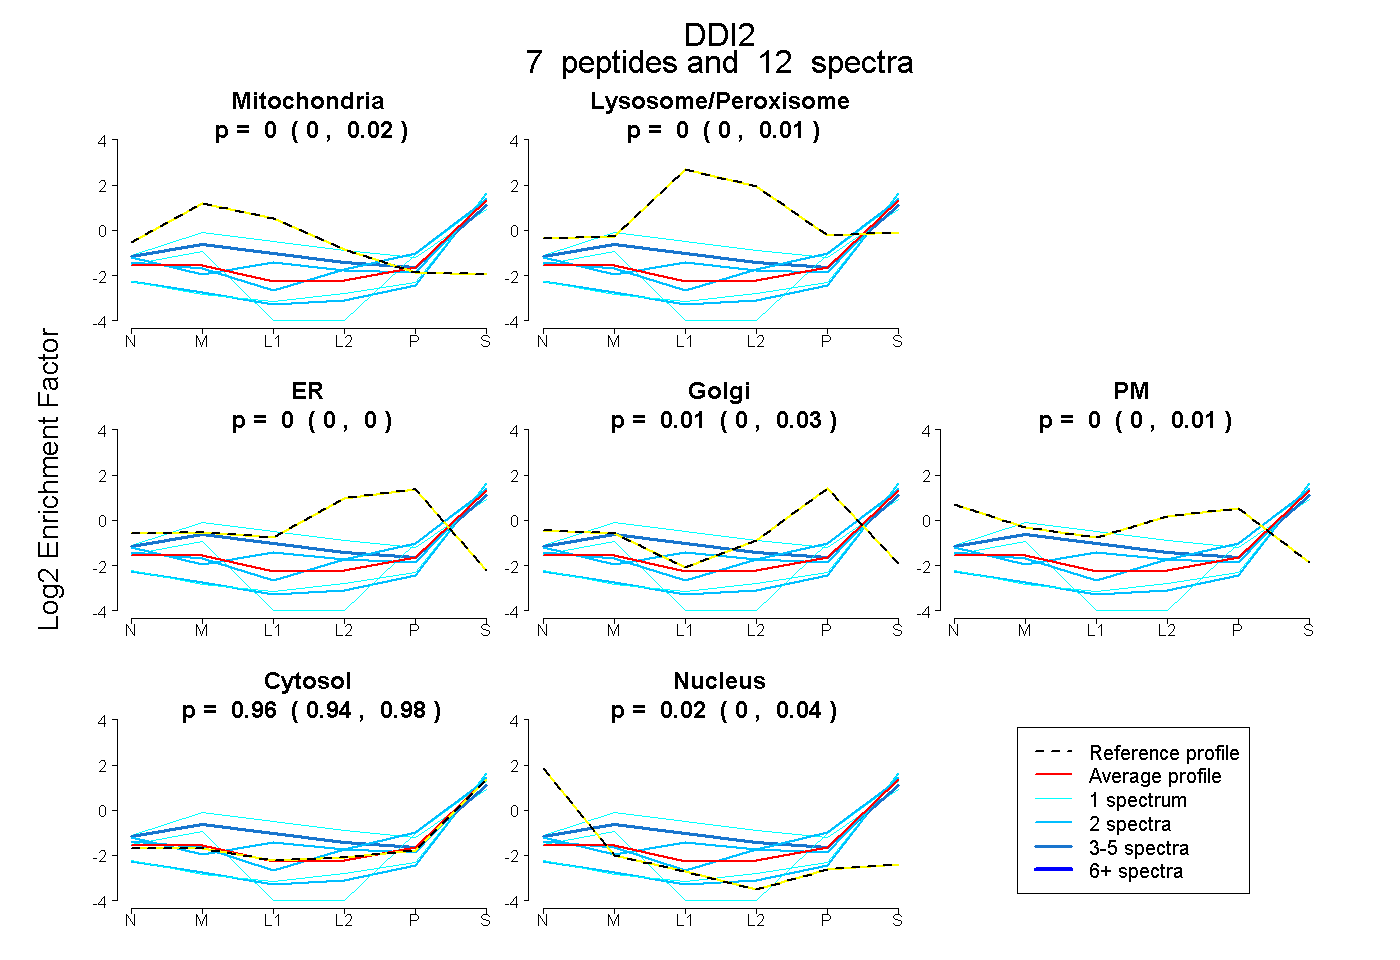
0.000 | 0.023
0.000 | 0.010
0.000 | 0.000
0.000 | 0.034
0.000 | 0.012
0.941 | 0.976
0.000 | 0.042