 7
7peptides
spectra
0.000 | 0.000
0.000 | 0.000
0.000 | 0.000
0.000 | 0.000
0.000 | 0.000
0.000 | 0.000
0.971 | 1.000
0.000 | 0.026
| Plot | Mito | Lyso | Perox | ER | Golgi | PM | Cytosol | Nucleus | |||||
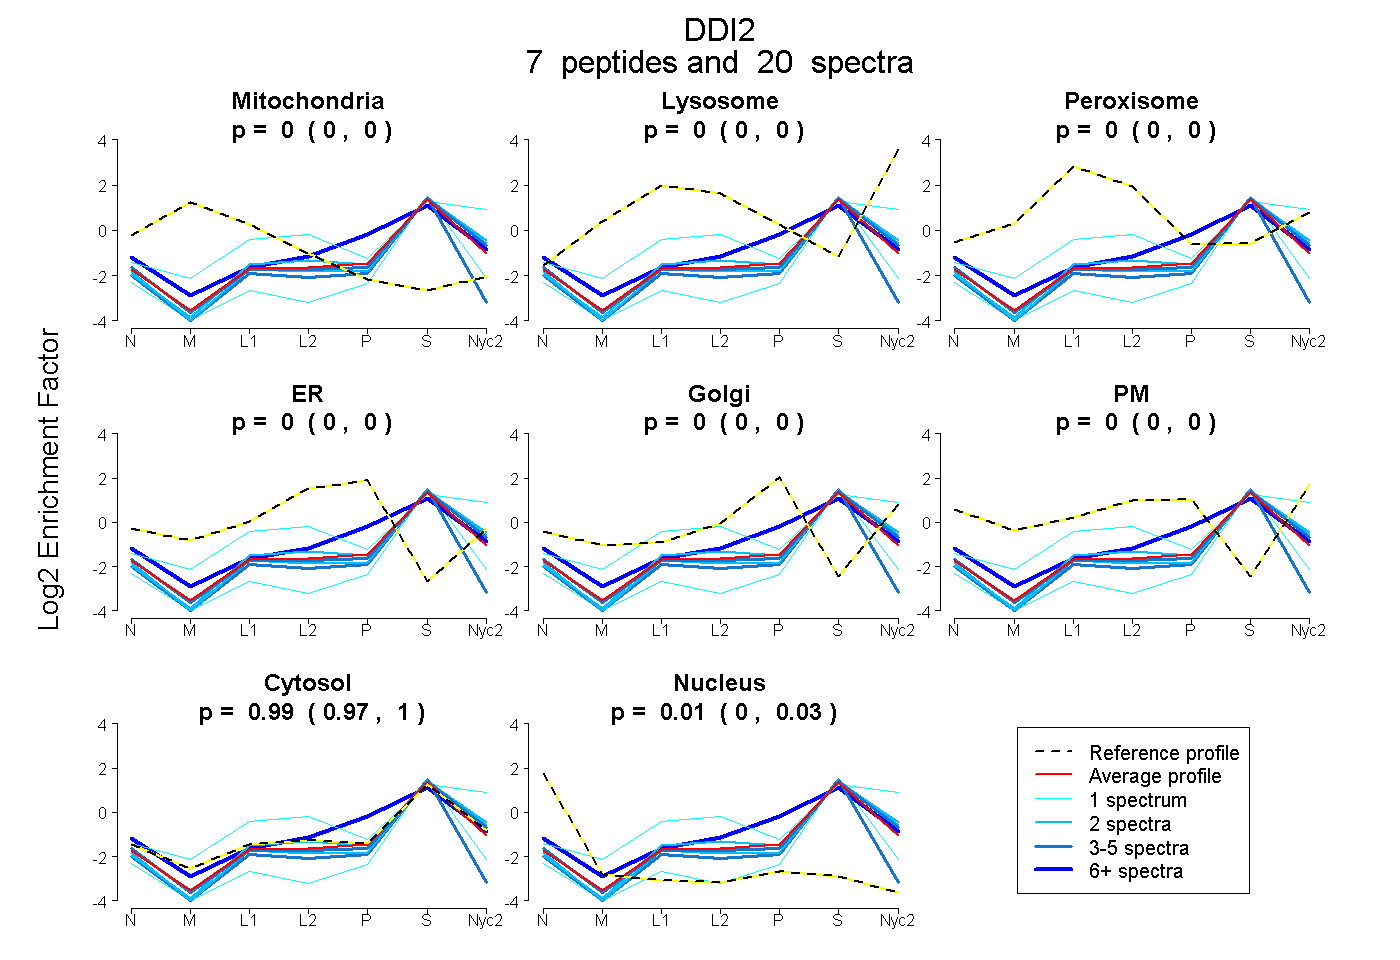
| Expt A |
7 peptides |
20 spectra |
|
0.000 0.000 | 0.000 |
0.000 0.000 | 0.000 |
0.000 0.000 | 0.000 |
0.000 0.000 | 0.000 |
0.000 0.000 | 0.000 |
0.000 0.000 | 0.000 |
0.988 0.971 | 1.000 |
0.012 0.000 | 0.026 |
| 1 spectrum, IDFSSIAVPGTSNPQQR | 0.000 | 0.000 | 0.000 | 0.000 | 0.000 | 0.000 | 0.839 | 0.161 | ||
| 5 spectra, MLLTVYCVR | 0.000 | 0.000 | 0.000 | 0.000 | 0.000 | 0.000 | 0.834 | 0.166 | ||
| 2 spectra, TQAQLLSPGER | 0.000 | 0.000 | 0.000 | 0.000 | 0.000 | 0.000 | 1.000 | 0.000 | ||
| 1 spectrum, LFSADPFDLEAQAK | 0.000 | 0.278 | 0.000 | 0.000 | 0.000 | 0.000 | 0.722 | 0.000 | ||
| 3 spectra, VLVEQQQDR | 0.000 | 0.000 | 0.000 | 0.000 | 0.000 | 0.000 | 0.998 | 0.002 | ||
| 6 spectra, LEEDLR | 0.000 | 0.000 | 0.000 | 0.000 | 0.136 | 0.000 | 0.864 | 0.000 | ||
| 2 spectra, SLASYGLK | 0.000 | 0.000 | 0.000 | 0.000 | 0.000 | 0.000 | 1.000 | 0.000 |
| Plot | Mito | Lyso or Perox | ER | Golgi | PM | Cytosol | Nucleus | ||||||
| Expt B |
7 peptides |
12 spectra |
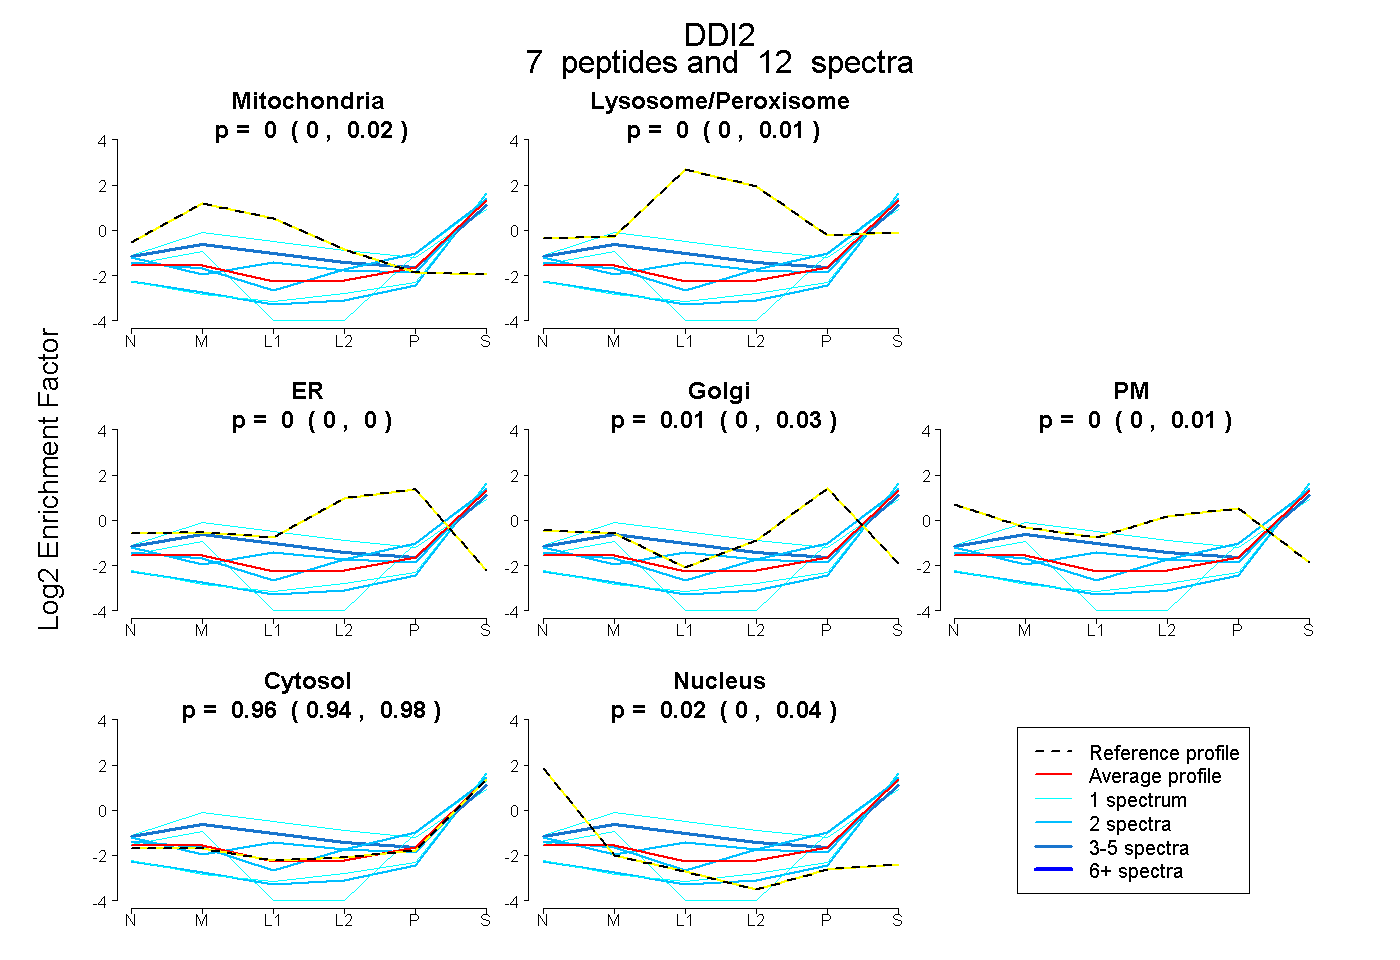 |
0.000 0.000 | 0.023 |
0.000 0.000 | 0.010 |
0.000 0.000 | 0.000 |
0.014 0.000 | 0.034 |
0.000 0.000 | 0.012 |
0.964 0.941 | 0.976 |
0.022 0.000 | 0.042 |
|||
| Plot | Lyso | Other | |||||||||||
| Expt C |
9 peptides |
23 spectra |
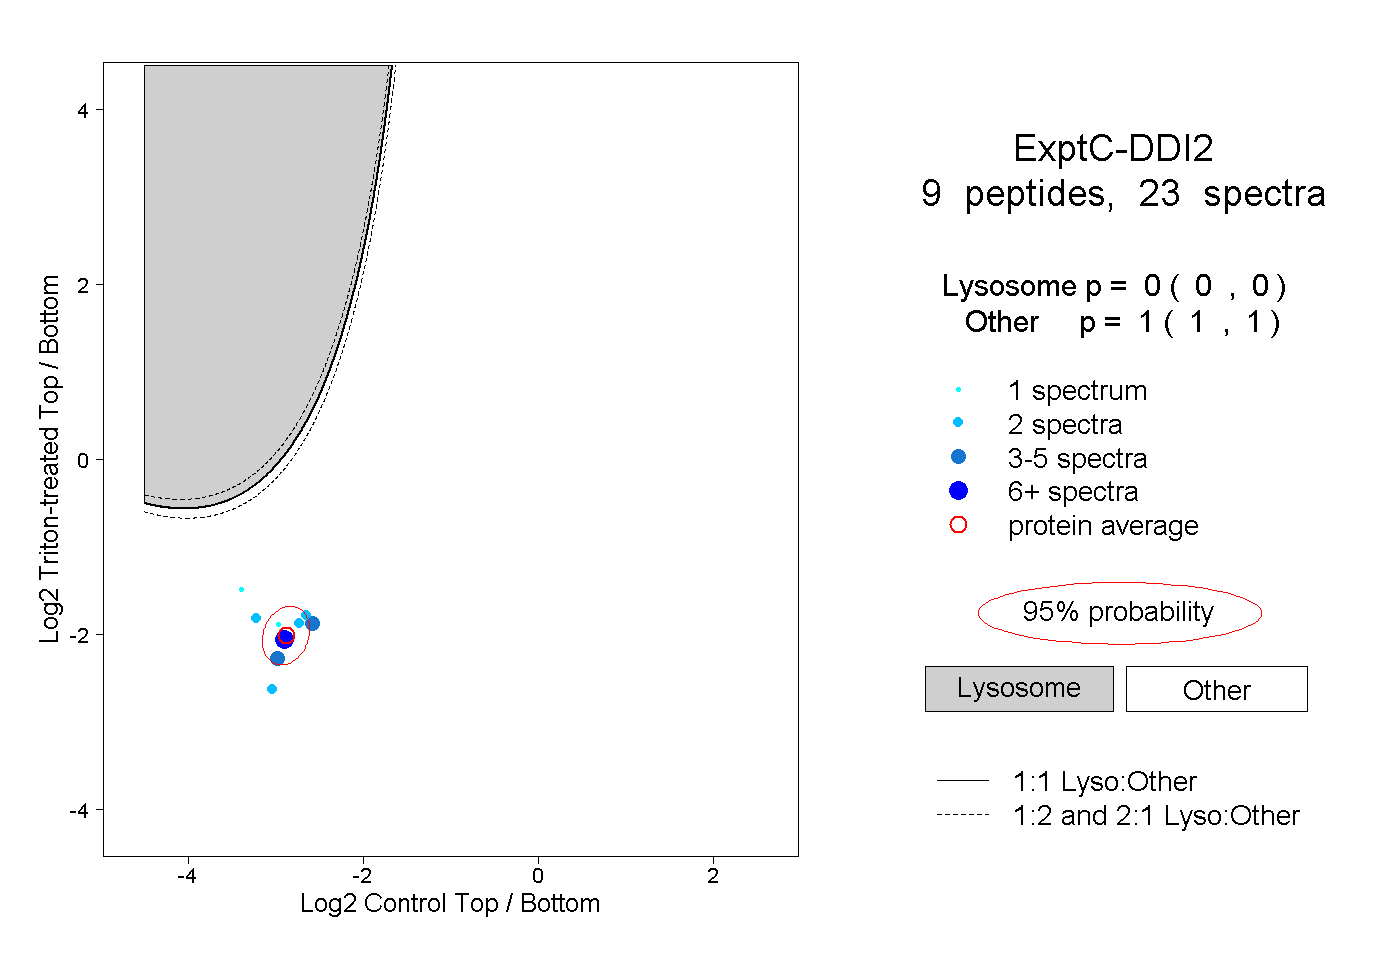 |
0.000 0.000 | 0.000 |
1.000 1.000 | 1.000 |
||||||||
| Plot | Lyso | Other | |||||||||||
| Expt D |
1 peptide |
1 spectrum |
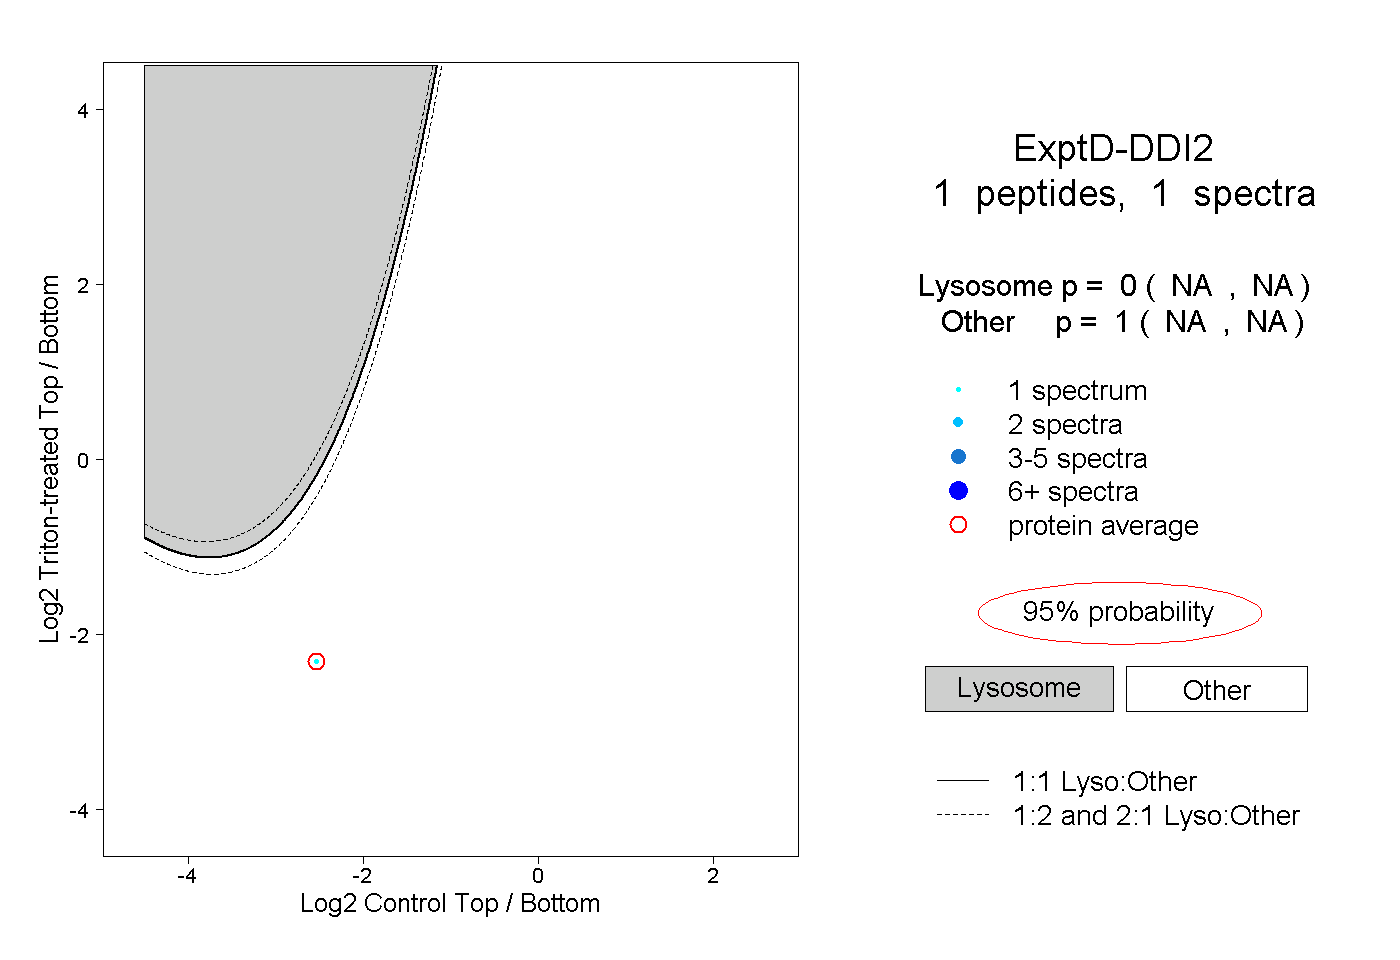 |
0.000 NA | NA |
1.000 NA | NA |