 8
8peptides
spectra
0.000 | 0.000
0.000 | 0.000
0.000 | 0.000
0.200 | 0.307
0.000 | 0.081
0.000 | 0.013
0.486 | 0.523
0.169 | 0.221
1peptide
spectra
NA | NA
NA | NA
NA | NA
NA | NA
NA | NA
NA | NA
NA | NA
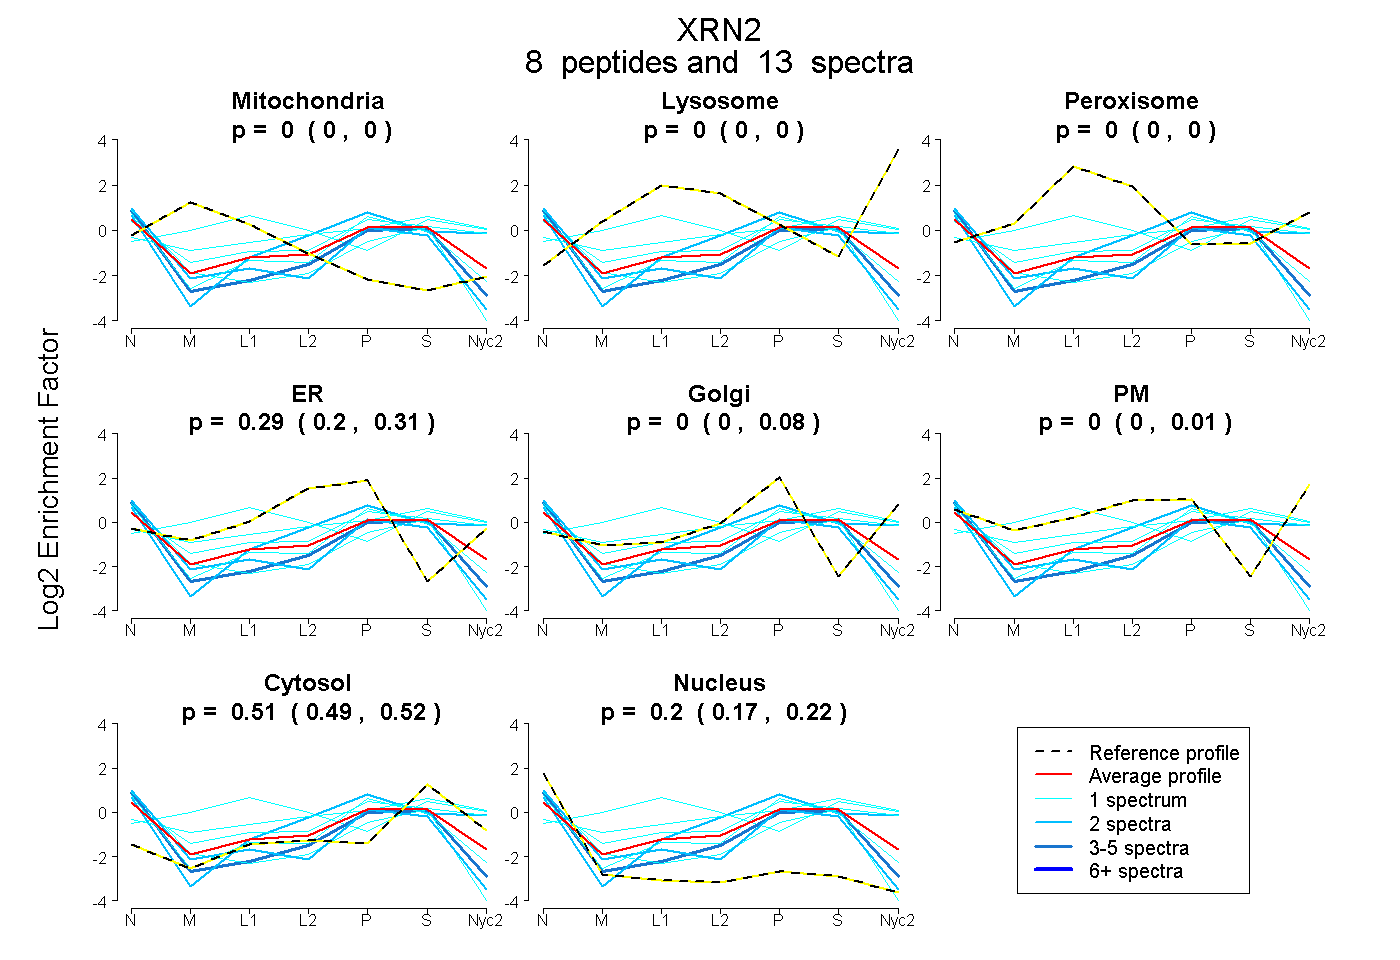
| Plot | Mito | Lyso | Perox | ER | Golgi | PM | Cytosol | Nucleus | |||||
| Expt A |
8 peptides |
13 spectra |
|
0.000 0.000 | 0.000 |
0.000 0.000 | 0.000 |
0.000 0.000 | 0.000 |
0.293 0.200 | 0.307 |
0.000 0.000 | 0.081 |
0.000 0.000 | 0.013 |
0.510 0.486 | 0.523 |
0.197 0.169 | 0.221 |
||
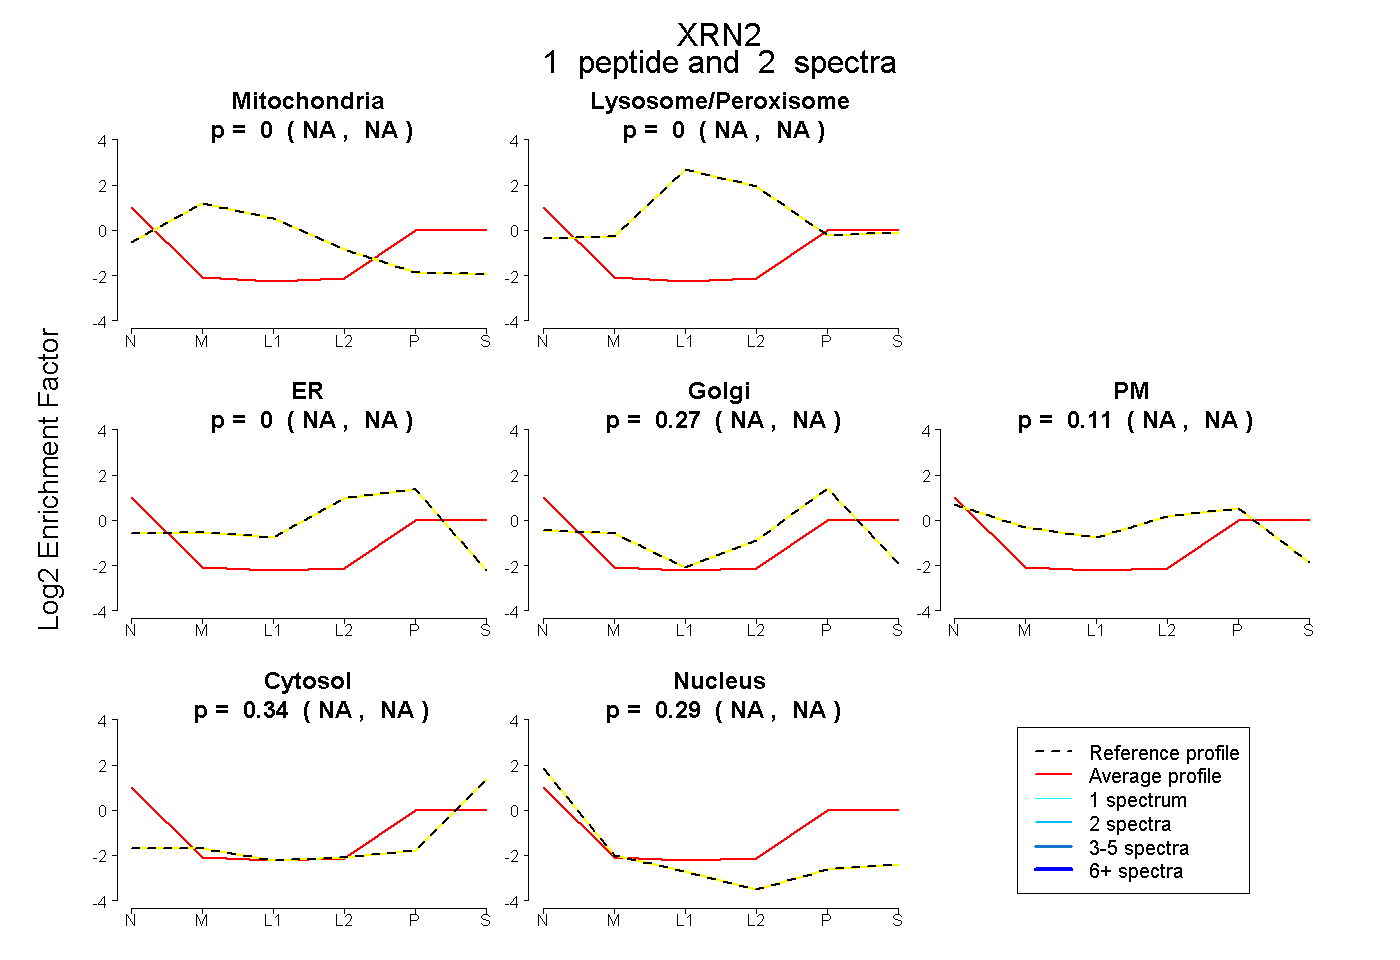
| Plot | Mito | Lyso or Perox | ER | Golgi | PM | Cytosol | Nucleus | ||||||
| Expt B |
1 peptide |
2 spectra |
|
0.000 NA | NA |
0.000 NA | NA |
0.000 NA | NA |
0.269 NA | NA |
0.105 NA | NA |
0.338 NA | NA |
0.287 NA | NA |
| 2 spectra, TLGHVIPR | 0.000 | 0.000 | 0.000 | 0.269 | 0.105 | 0.338 | 0.287 |
| Plot | Lyso | Other | |||||||||||
| Expt C |
1 peptide |
1 spectrum |
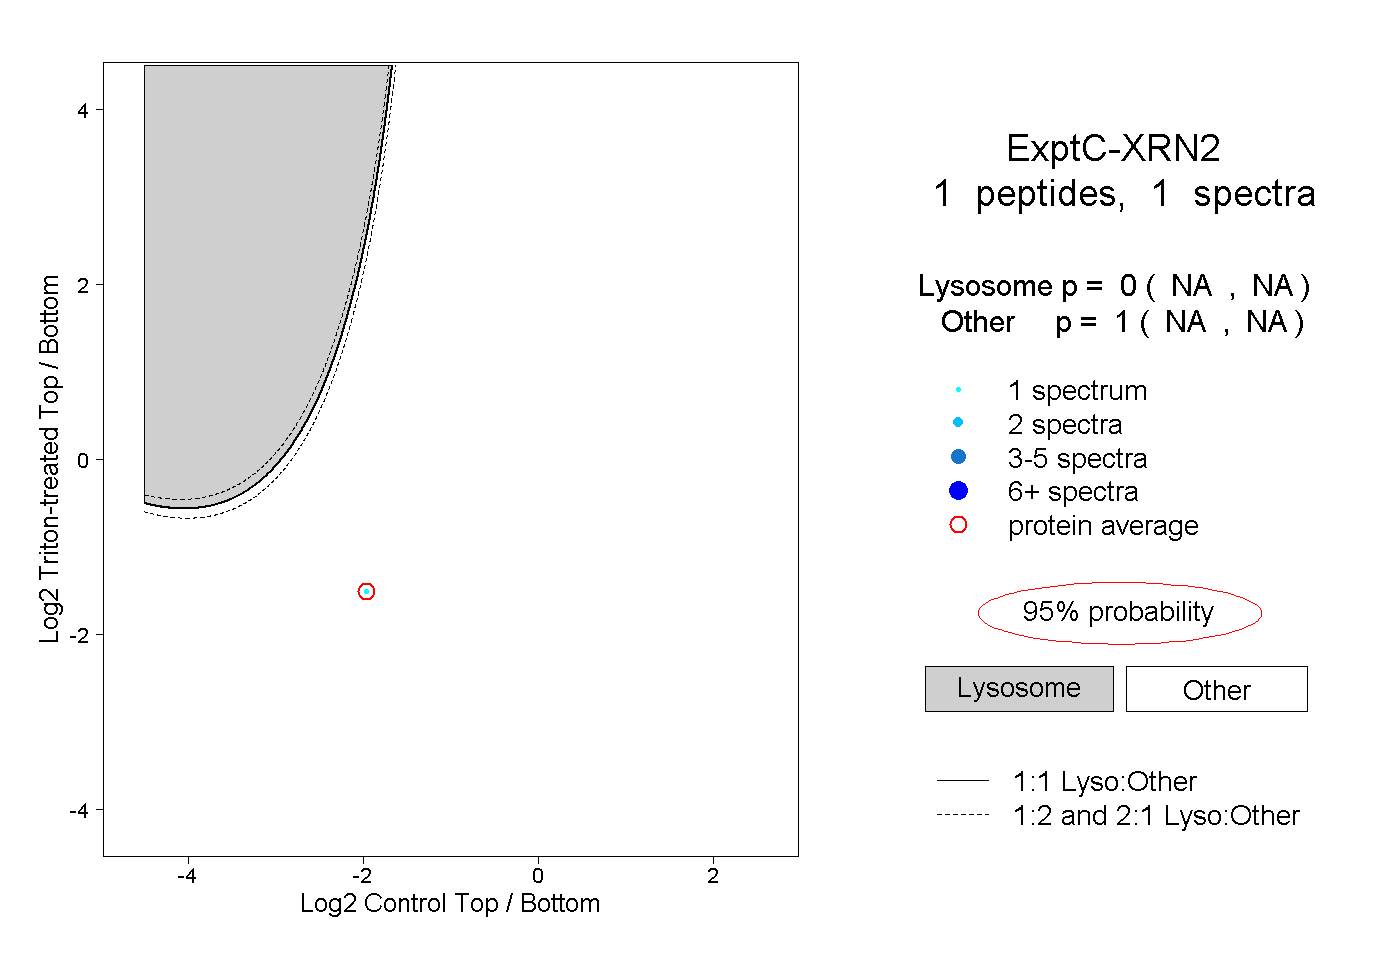 |
0.000 NA | NA |
1.000 NA | NA |