 8
8peptides
spectra
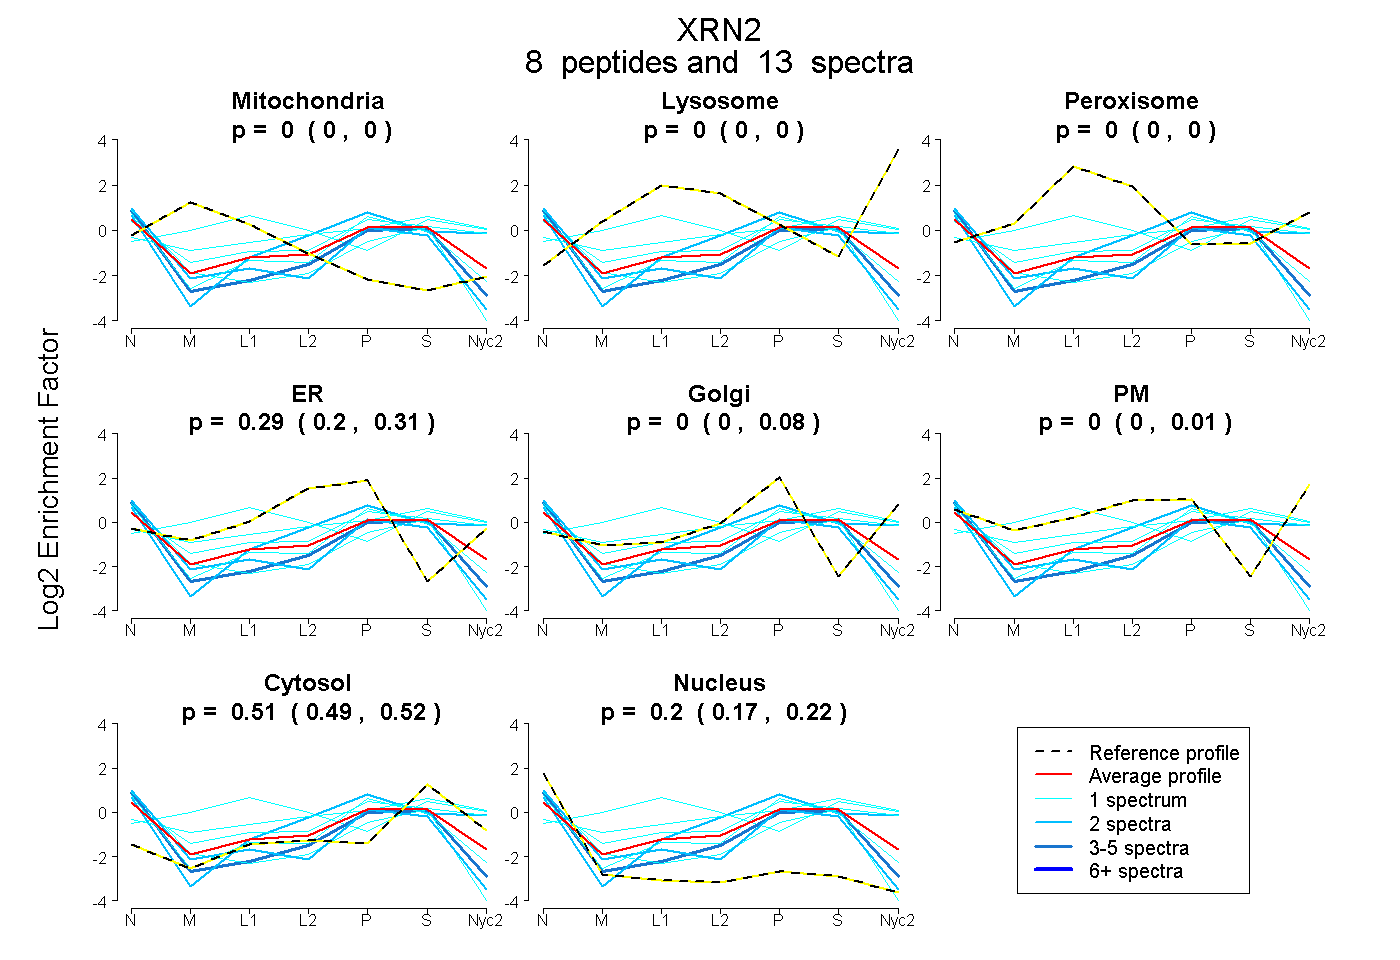
0.000 | 0.000
0.000 | 0.000
0.000 | 0.000
0.200 | 0.307
0.000 | 0.081
0.000 | 0.013
0.486 | 0.523
0.169 | 0.221
| Plot | Mito | Lyso | Perox | ER | Golgi | PM | Cytosol | Nucleus | |||||
| Expt A |
8 peptides |
13 spectra |
|
0.000 0.000 | 0.000 |
0.000 0.000 | 0.000 |
0.000 0.000 | 0.000 |
0.293 0.200 | 0.307 |
0.000 0.000 | 0.081 |
0.000 0.000 | 0.013 |
0.510 0.486 | 0.523 |
0.197 0.169 | 0.221 |
| 1 spectrum, DLTQNTAISINFK | 0.000 | 0.000 | 0.000 | 0.082 | 0.000 | 0.000 | 0.416 | 0.502 | ||
| 1 spectrum, AALEEVYPDLTPEENR | 0.127 | 0.040 | 0.443 | 0.000 | 0.000 | 0.000 | 0.391 | 0.000 | ||
| 2 spectra, LWEAGWK | 0.000 | 0.000 | 0.000 | 0.079 | 0.311 | 0.063 | 0.485 | 0.061 | ||
| 2 spectra, QWKPQLGFNR | 0.000 | 0.000 | 0.000 | 0.176 | 0.000 | 0.000 | 0.356 | 0.468 | ||
| 1 spectrum, NSPGCQVASNPR | 0.000 | 0.000 | 0.167 | 0.000 | 0.102 | 0.200 | 0.532 | 0.000 | ||
| 1 spectrum, TLGHVIPR | 0.000 | 0.000 | 0.000 | 0.274 | 0.003 | 0.000 | 0.439 | 0.285 | ||
| 4 spectra, AIMLPGAR | 0.000 | 0.000 | 0.000 | 0.152 | 0.000 | 0.000 | 0.451 | 0.396 | ||
| 1 spectrum, QAAYEMR | 0.000 | 0.000 | 0.000 | 0.000 | 0.178 | 0.278 | 0.502 | 0.043 |
| Plot | Mito | Lyso or Perox | ER | Golgi | PM | Cytosol | Nucleus | ||||||
| Expt B |
1 peptide |
2 spectra |
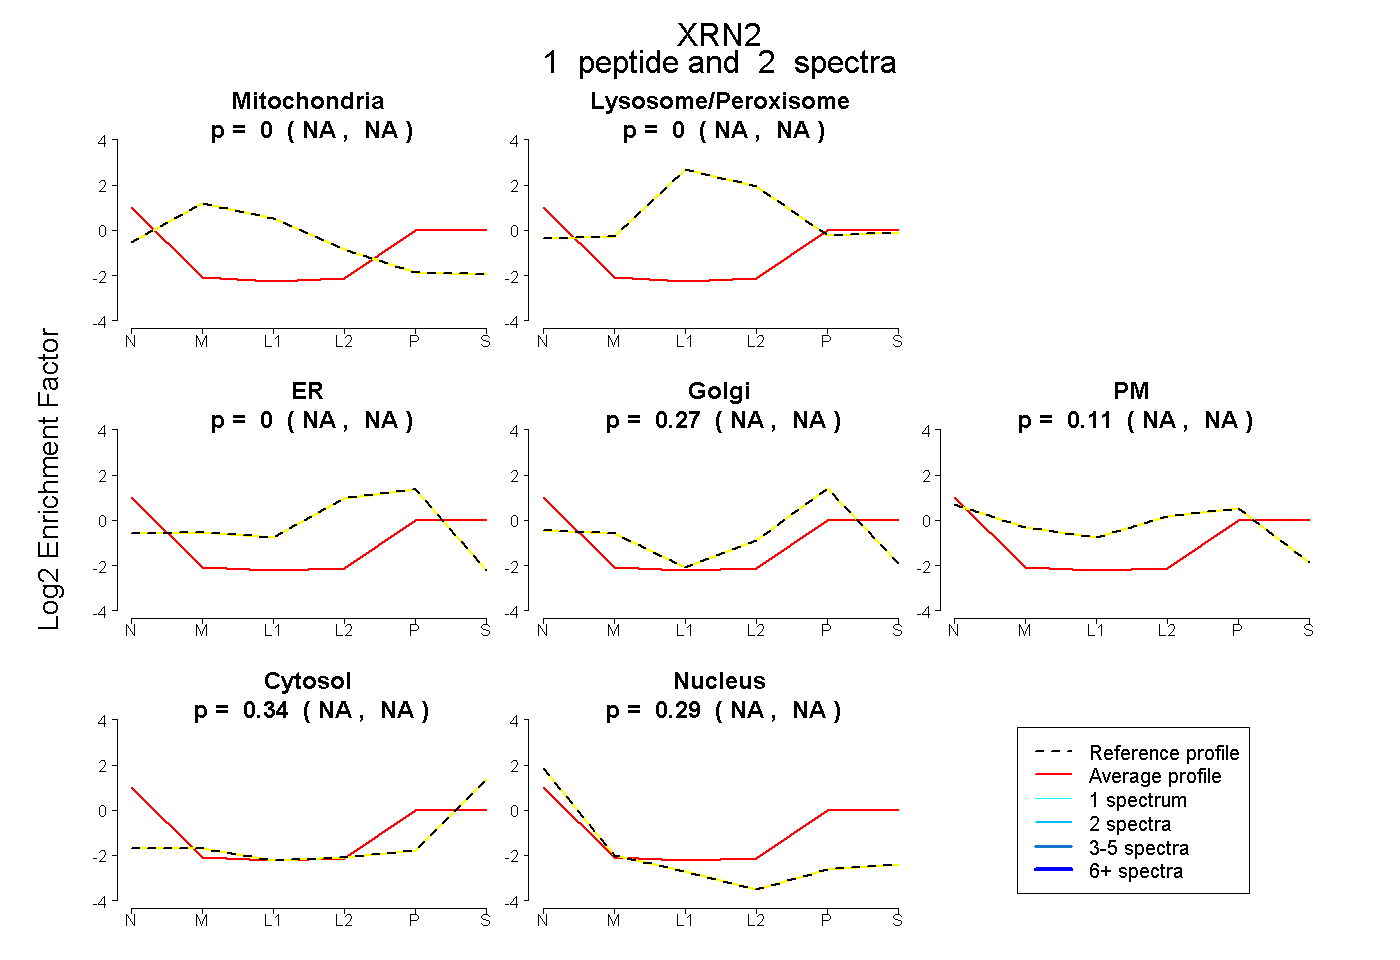 |
0.000 NA | NA |
0.000 NA | NA |
0.000 NA | NA |
0.269 NA | NA |
0.105 NA | NA |
0.338 NA | NA |
0.287 NA | NA |
|||
| Plot | Lyso | Other | |||||||||||
| Expt C |
1 peptide |
1 spectrum |
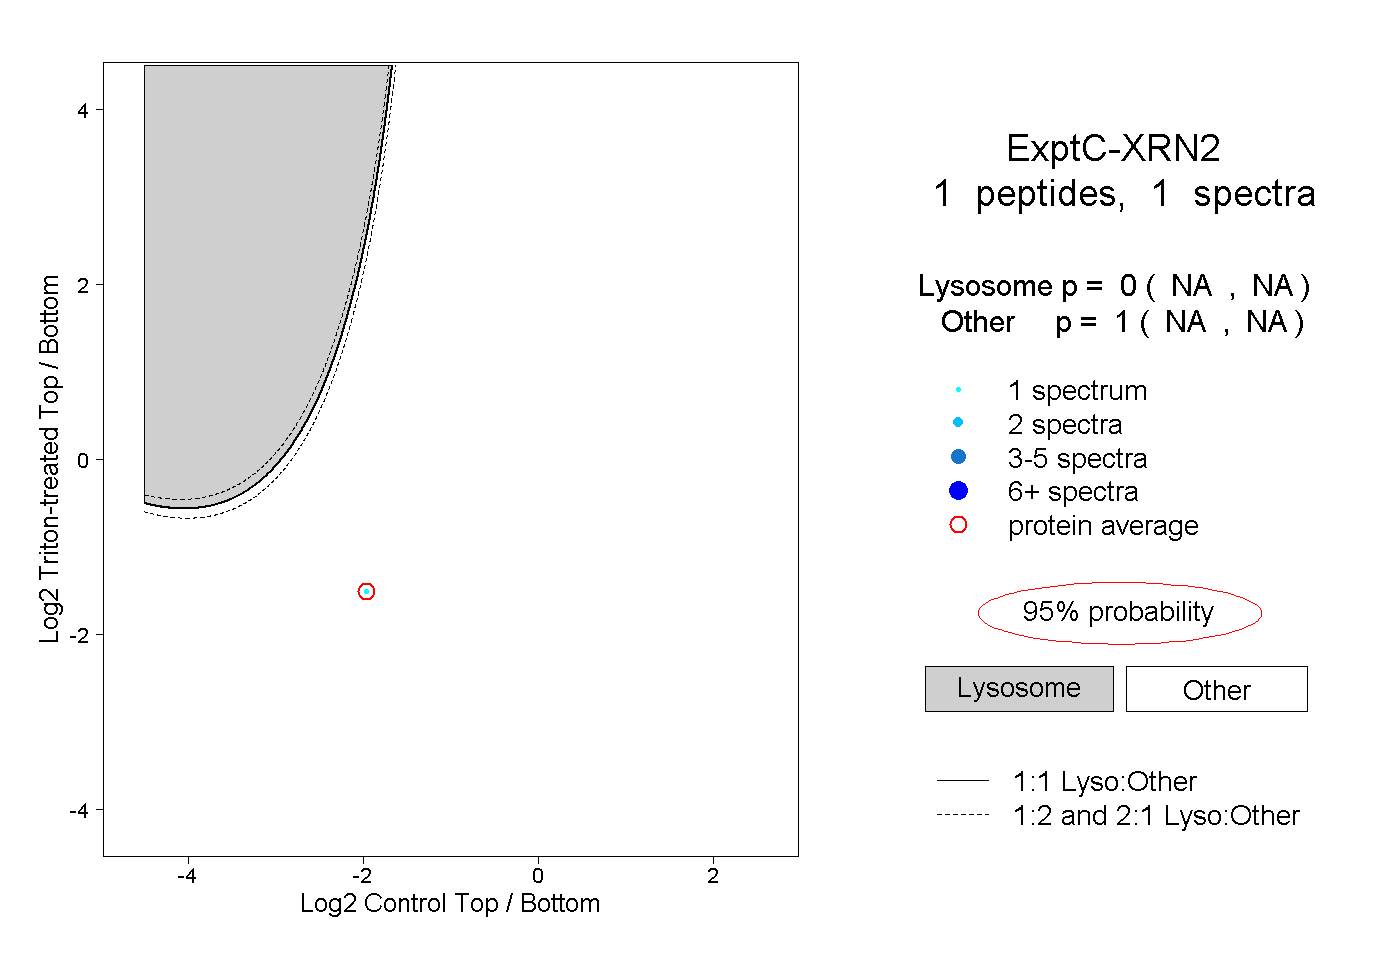 |
0.000 NA | NA |
1.000 NA | NA |