14
14peptides
spectra
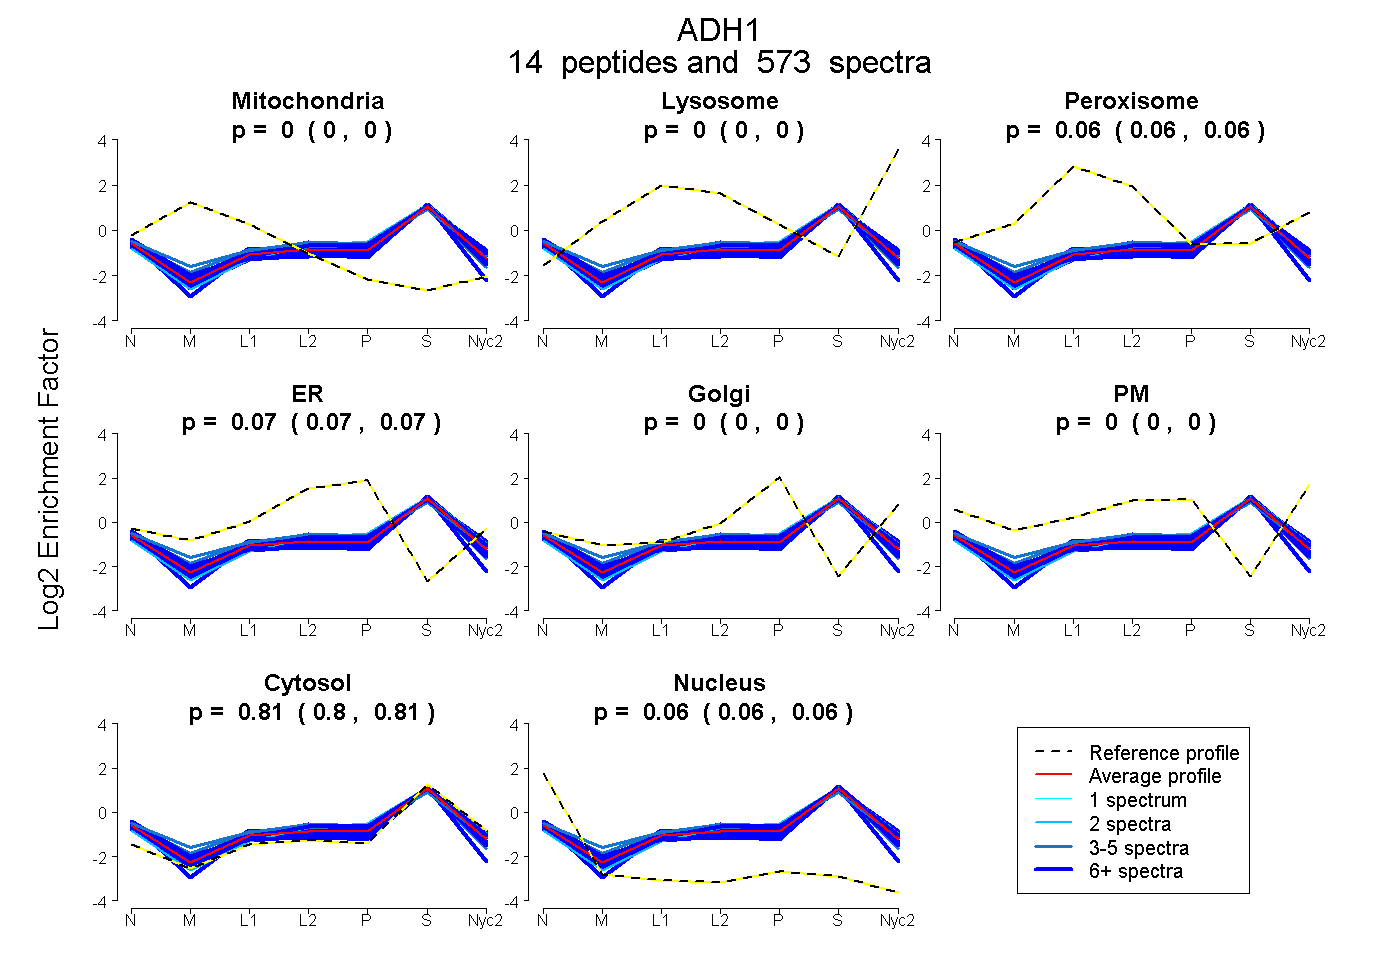
0.000 | 0.000
0.000 | 0.000
0.063 | 0.065
0.070 | 0.071
0.000 | 0.000
0.000 | 0.000
0.804 | 0.806
0.060 | 0.061
11peptides
spectra
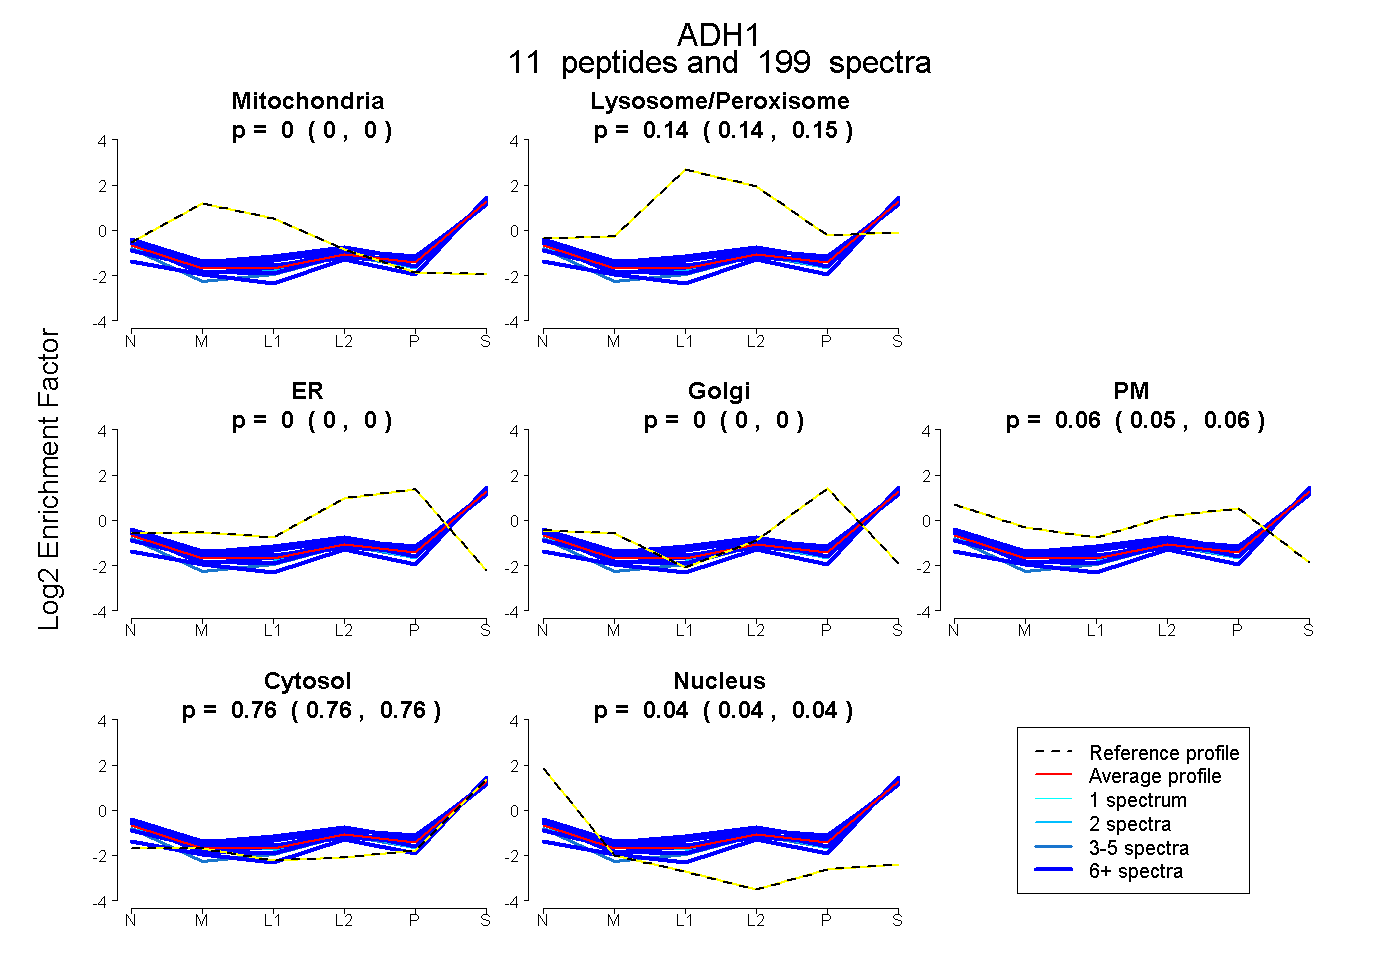
0.000 | 0.000
0.139 | 0.146
0.000 | 0.000
0.000 | 0.000
0.050 | 0.060
0.760 | 0.765
0.036 | 0.042
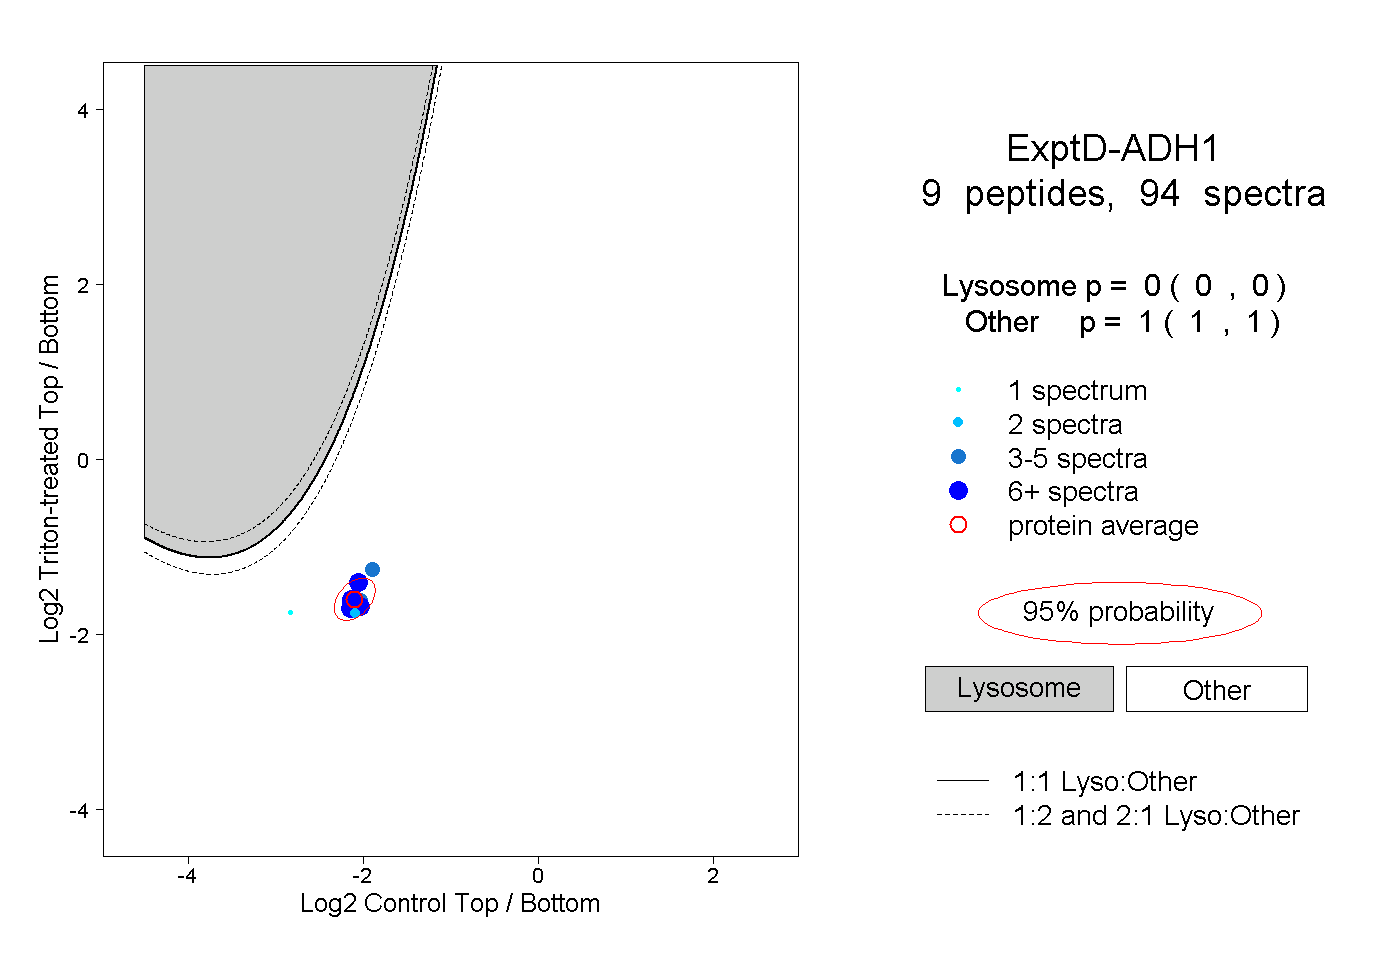
15peptides
spectra
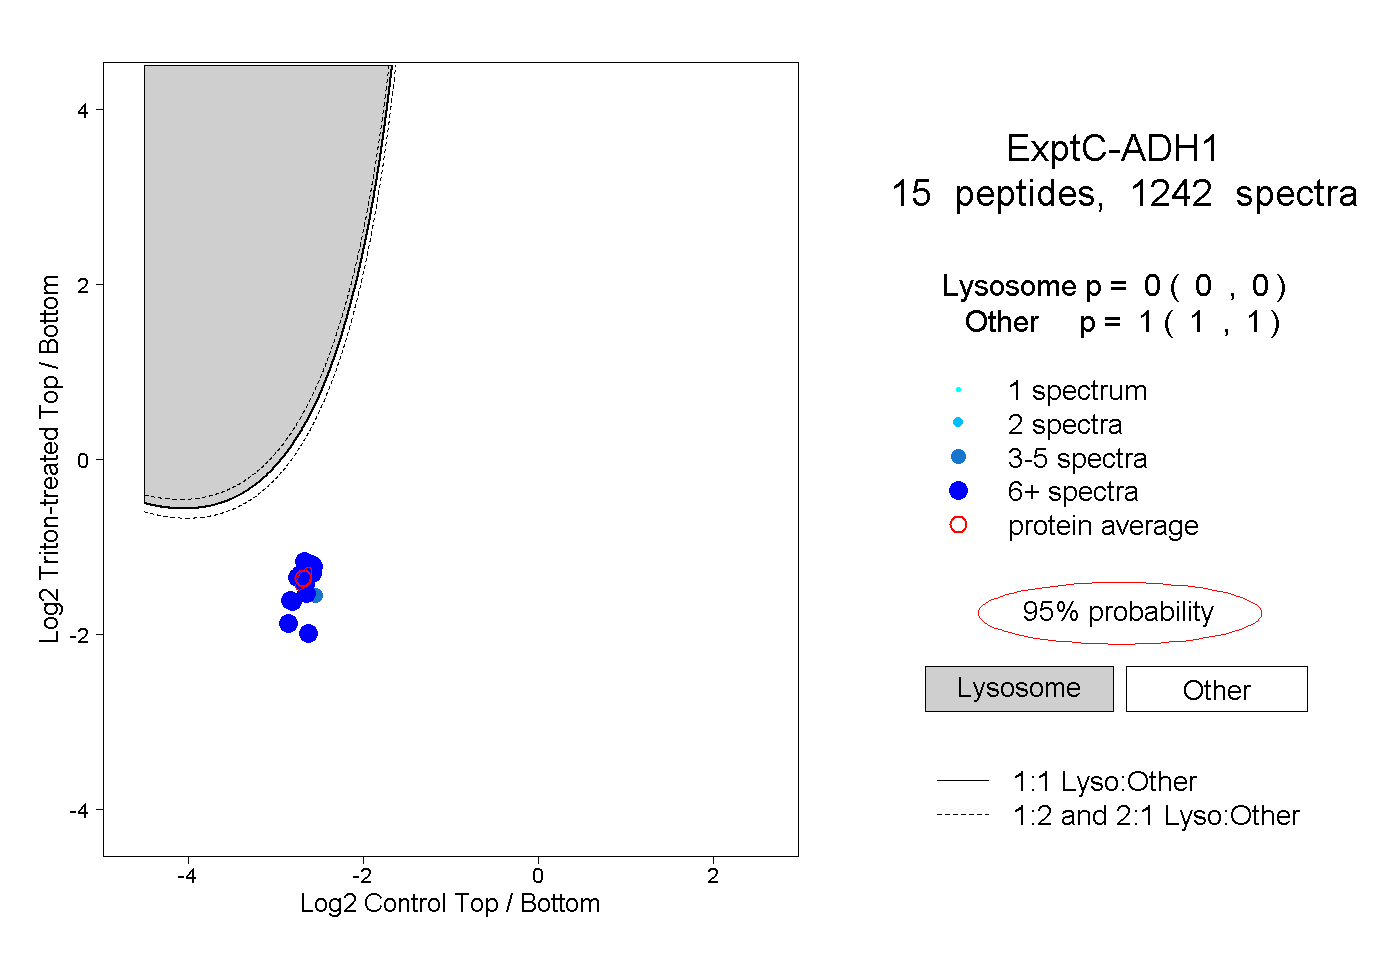
0.000 | 0.000
1.000 | 1.000