 14
14peptides
spectra
0.000 | 0.000
0.000 | 0.000
0.063 | 0.065
0.070 | 0.071
0.000 | 0.000
0.000 | 0.000
0.804 | 0.806
0.060 | 0.061
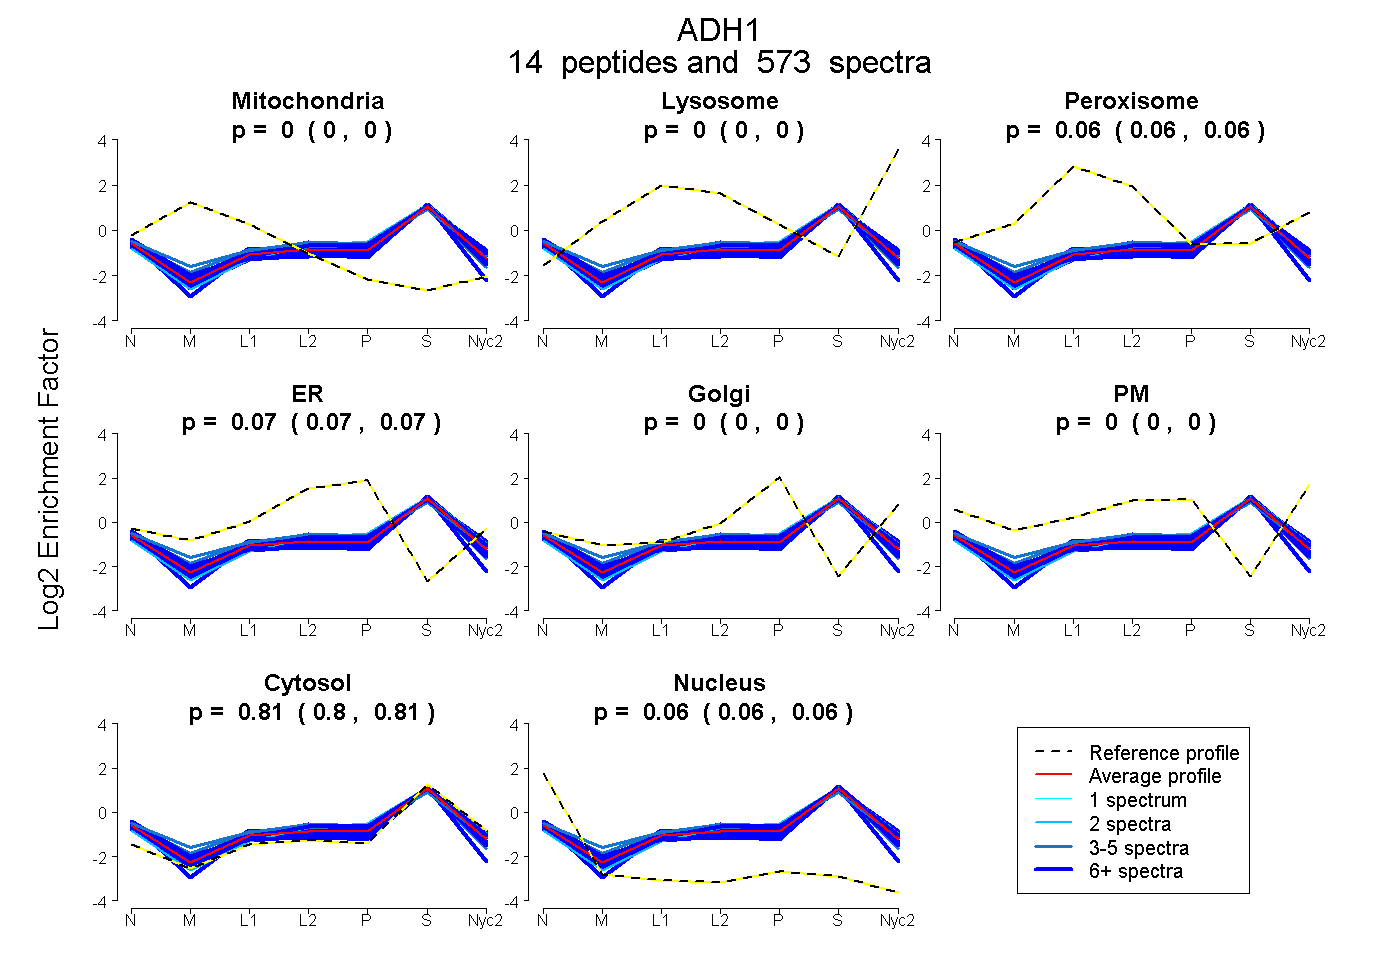
| Plot | Mito | Lyso | Perox | ER | Golgi | PM | Cytosol | Nucleus | |||||
| Expt A |
14 peptides |
573 spectra |
|
0.000 0.000 | 0.000 |
0.000 0.000 | 0.000 |
0.064 0.063 | 0.065 |
0.071 0.070 | 0.071 |
0.000 0.000 | 0.000 |
0.000 0.000 | 0.000 |
0.805 0.804 | 0.806 |
0.061 0.060 | 0.061 |
| 37 spectra, IDAAAPLDK | 0.000 | 0.000 | 0.097 | 0.067 | 0.000 | 0.000 | 0.784 | 0.052 | ||
| 71 spectra, LVADFMAK | 0.000 | 0.000 | 0.068 | 0.064 | 0.000 | 0.000 | 0.827 | 0.041 | ||
| 94 spectra, INEAFDLLR | 0.000 | 0.000 | 0.057 | 0.066 | 0.000 | 0.000 | 0.817 | 0.060 | ||
| 5 spectra, HPESNLCCQTK | 0.006 | 0.000 | 0.120 | 0.062 | 0.000 | 0.000 | 0.719 | 0.093 | ||
| 5 spectra, VCLIGCGFSTGYGSAVQVAK | 0.003 | 0.000 | 0.118 | 0.130 | 0.000 | 0.000 | 0.704 | 0.045 | ||
| 28 spectra, NLTQPK | 0.000 | 0.000 | 0.081 | 0.082 | 0.000 | 0.034 | 0.765 | 0.038 | ||
| 16 spectra, IIAVDINK | 0.000 | 0.000 | 0.051 | 0.013 | 0.000 | 0.000 | 0.869 | 0.066 | ||
| 8 spectra, FPLEPLITHVLPFEK | 0.000 | 0.000 | 0.017 | 0.092 | 0.000 | 0.000 | 0.831 | 0.060 | ||
| 21 spectra, VIPLFSPQCGK | 0.000 | 0.000 | 0.000 | 0.157 | 0.000 | 0.000 | 0.834 | 0.009 | ||
| 46 spectra, GAIFGGFK | 0.000 | 0.000 | 0.054 | 0.041 | 0.000 | 0.000 | 0.830 | 0.076 | ||
| 96 spectra, GALLDGTSR | 0.000 | 0.000 | 0.112 | 0.042 | 0.000 | 0.000 | 0.778 | 0.068 | ||
| 2 spectra, STAGK | 0.000 | 0.000 | 0.000 | 0.142 | 0.000 | 0.000 | 0.858 | 0.000 | ||
| 18 spectra, TAGAAK | 0.026 | 0.000 | 0.067 | 0.005 | 0.000 | 0.000 | 0.805 | 0.097 | ||
| 126 spectra, MVATGVCR | 0.000 | 0.000 | 0.038 | 0.042 | 0.000 | 0.000 | 0.809 | 0.111 |
| Plot | Mito | Lyso or Perox | ER | Golgi | PM | Cytosol | Nucleus | ||||||
| Expt B |
11 peptides |
199 spectra |
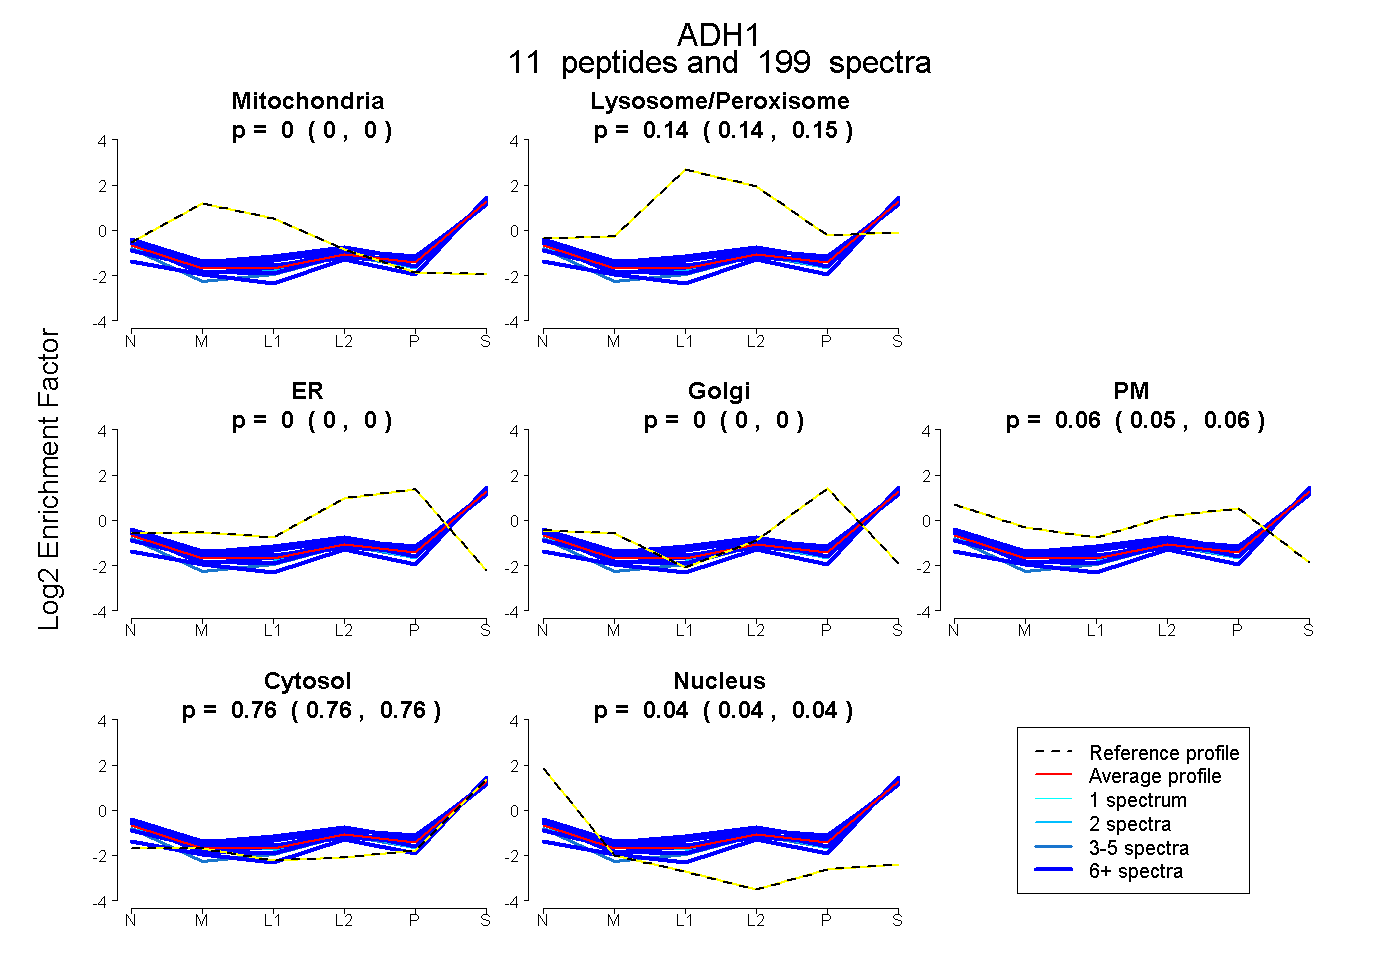 |
0.000 0.000 | 0.000 |
0.143 0.139 | 0.146 |
0.000 0.000 | 0.000 |
0.000 0.000 | 0.000 |
0.055 0.050 | 0.060 |
0.763 0.760 | 0.765 |
0.039 0.036 | 0.042 |
|||
| Plot | Lyso | Other | |||||||||||
| Expt C |
15 peptides |
1242 spectra |
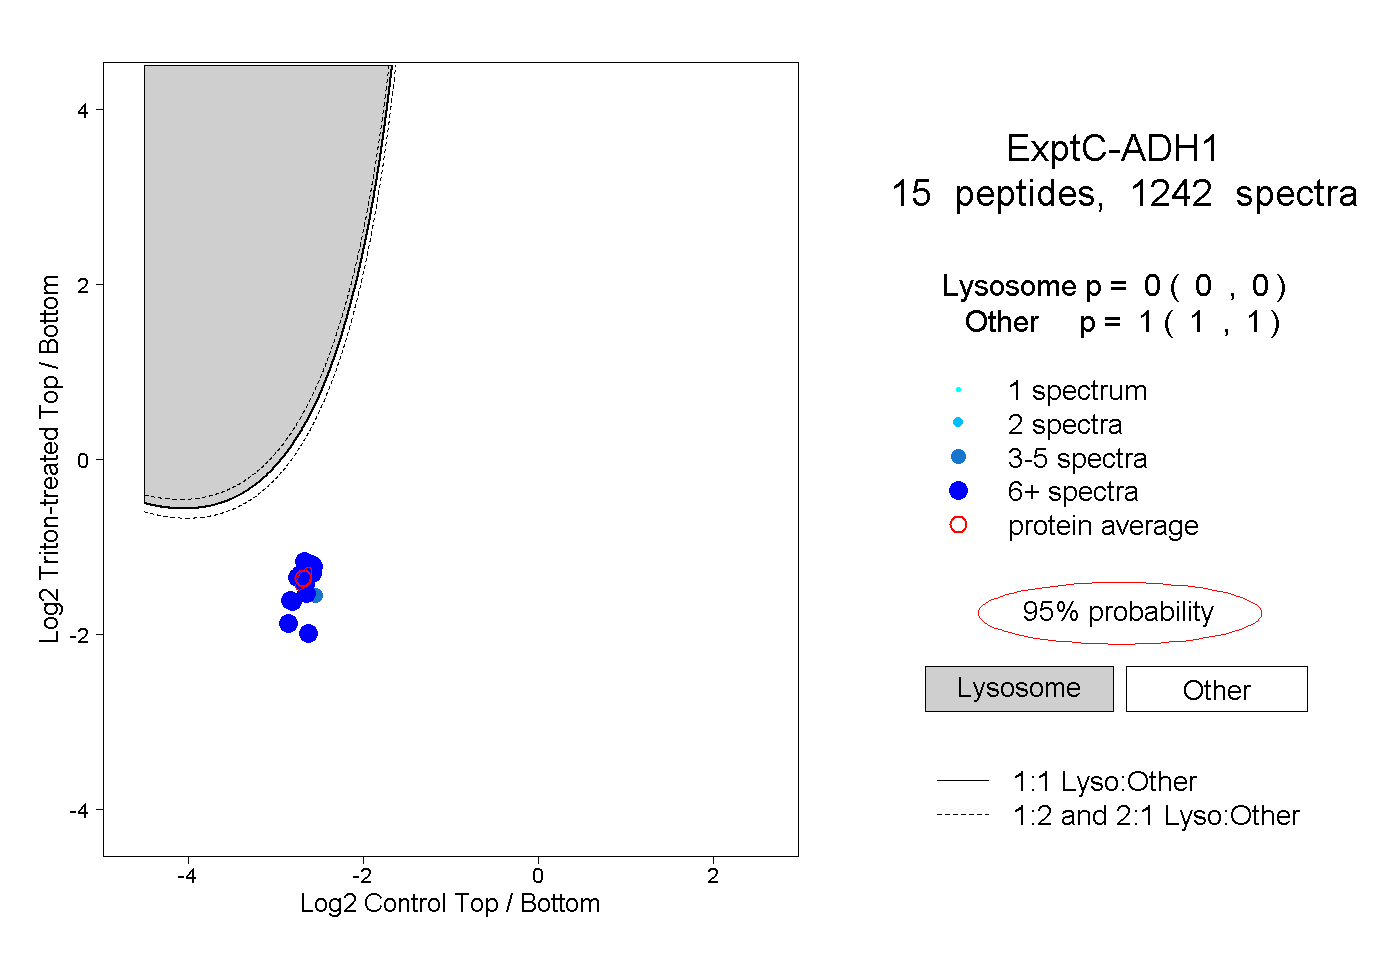 |
0.000 0.000 | 0.000 |
1.000 1.000 | 1.000 |
||||||||
| Plot | Lyso | Other | |||||||||||
| Expt D |
9 peptides |
94 spectra |
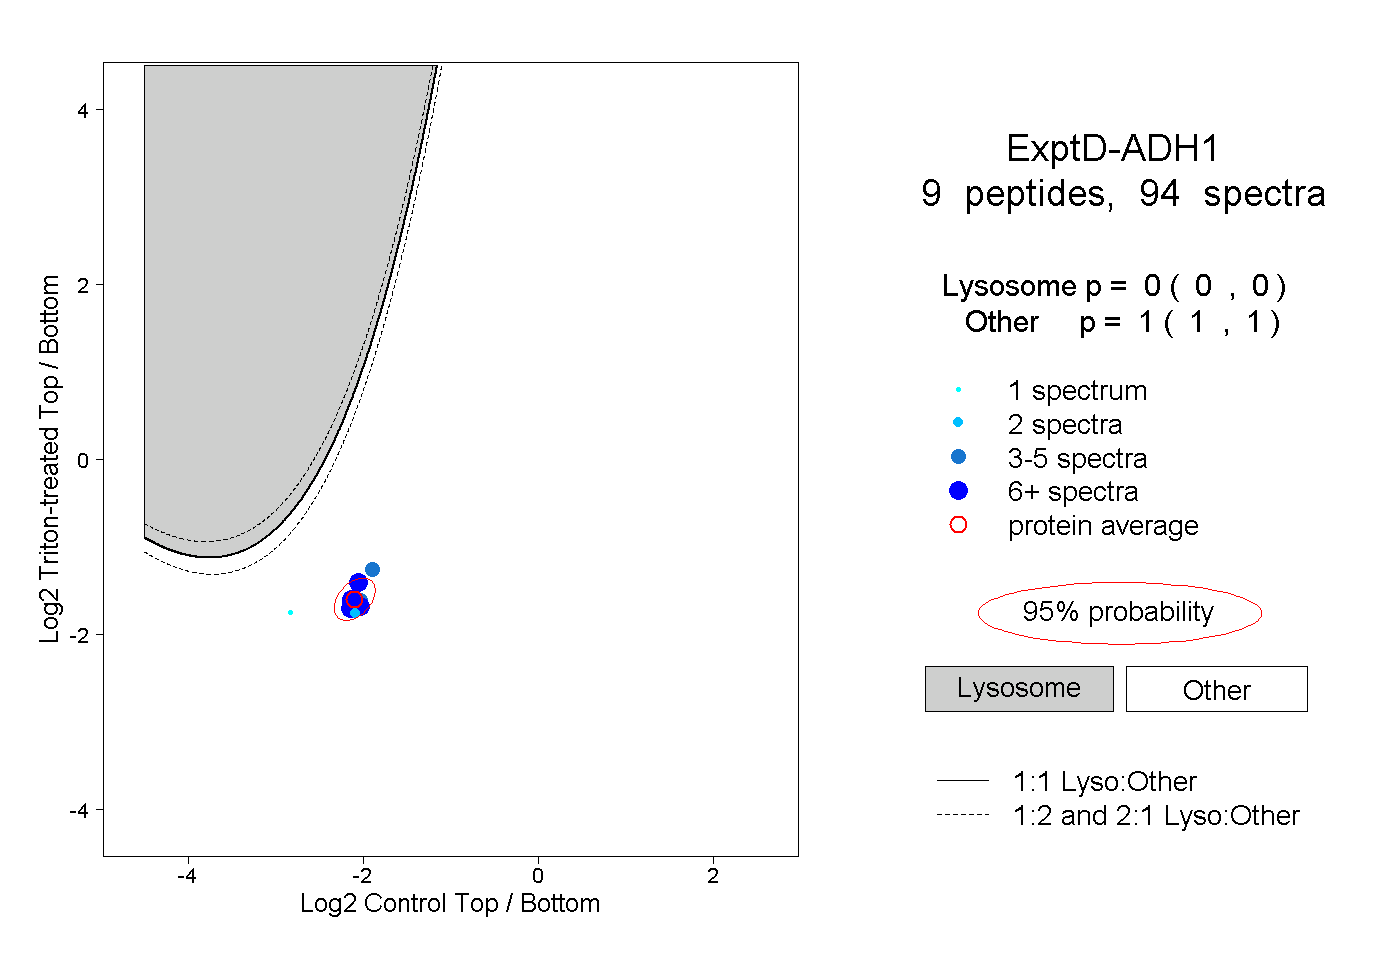 |
0.000 0.000 | 0.000 |
1.000 1.000 | 1.000 |