19
19peptides
spectra
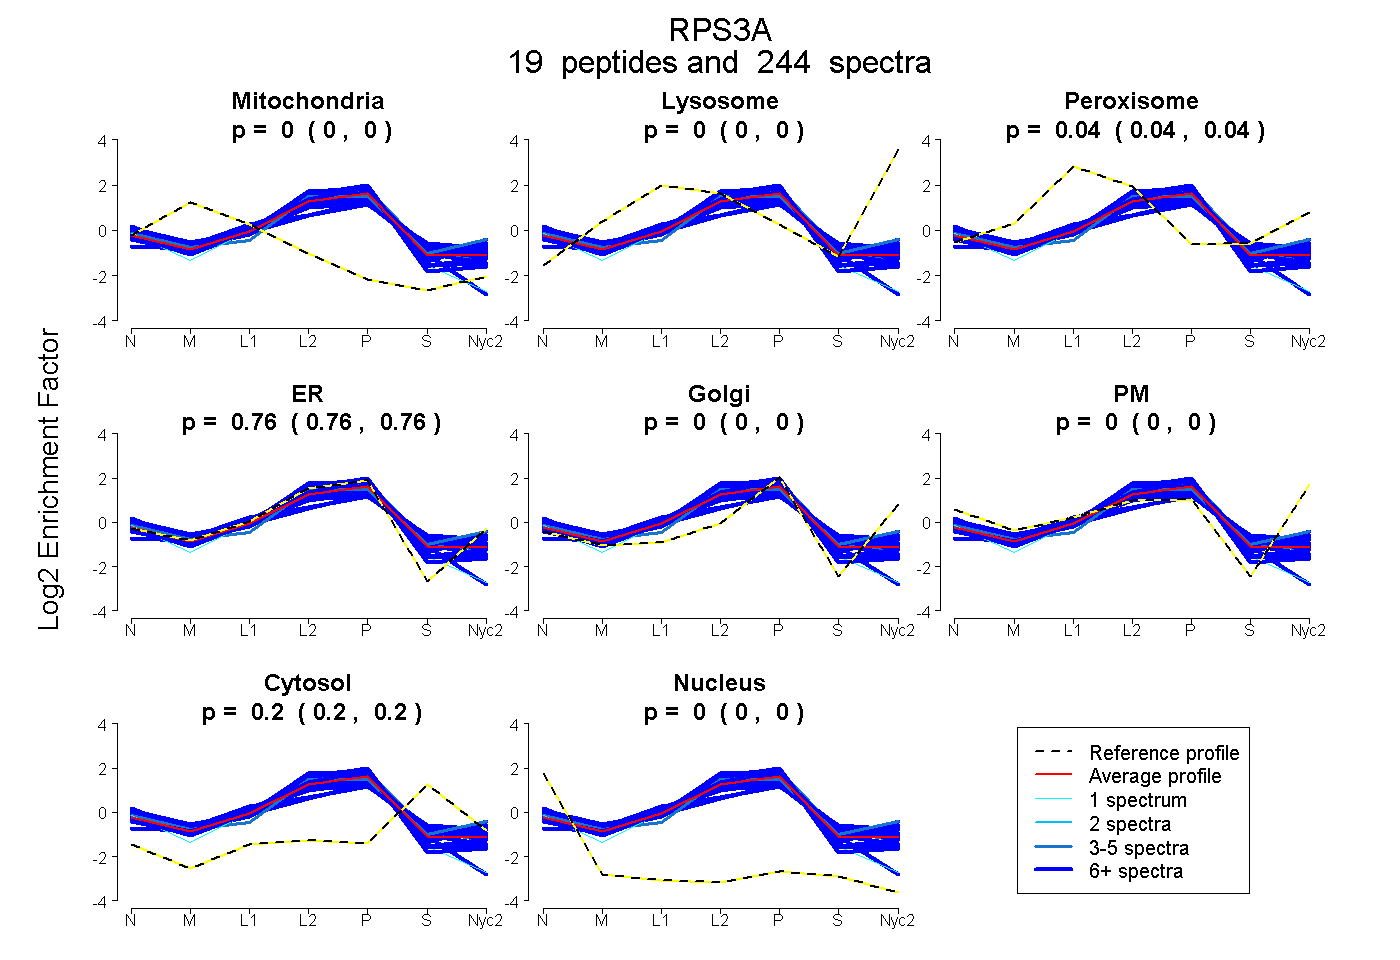
0.000 | 0.000
0.000 | 0.000
0.040 | 0.043
0.757 | 0.761
0.000 | 0.000
0.000 | 0.000
0.198 | 0.201
0.000 | 0.000
13peptides
spectra
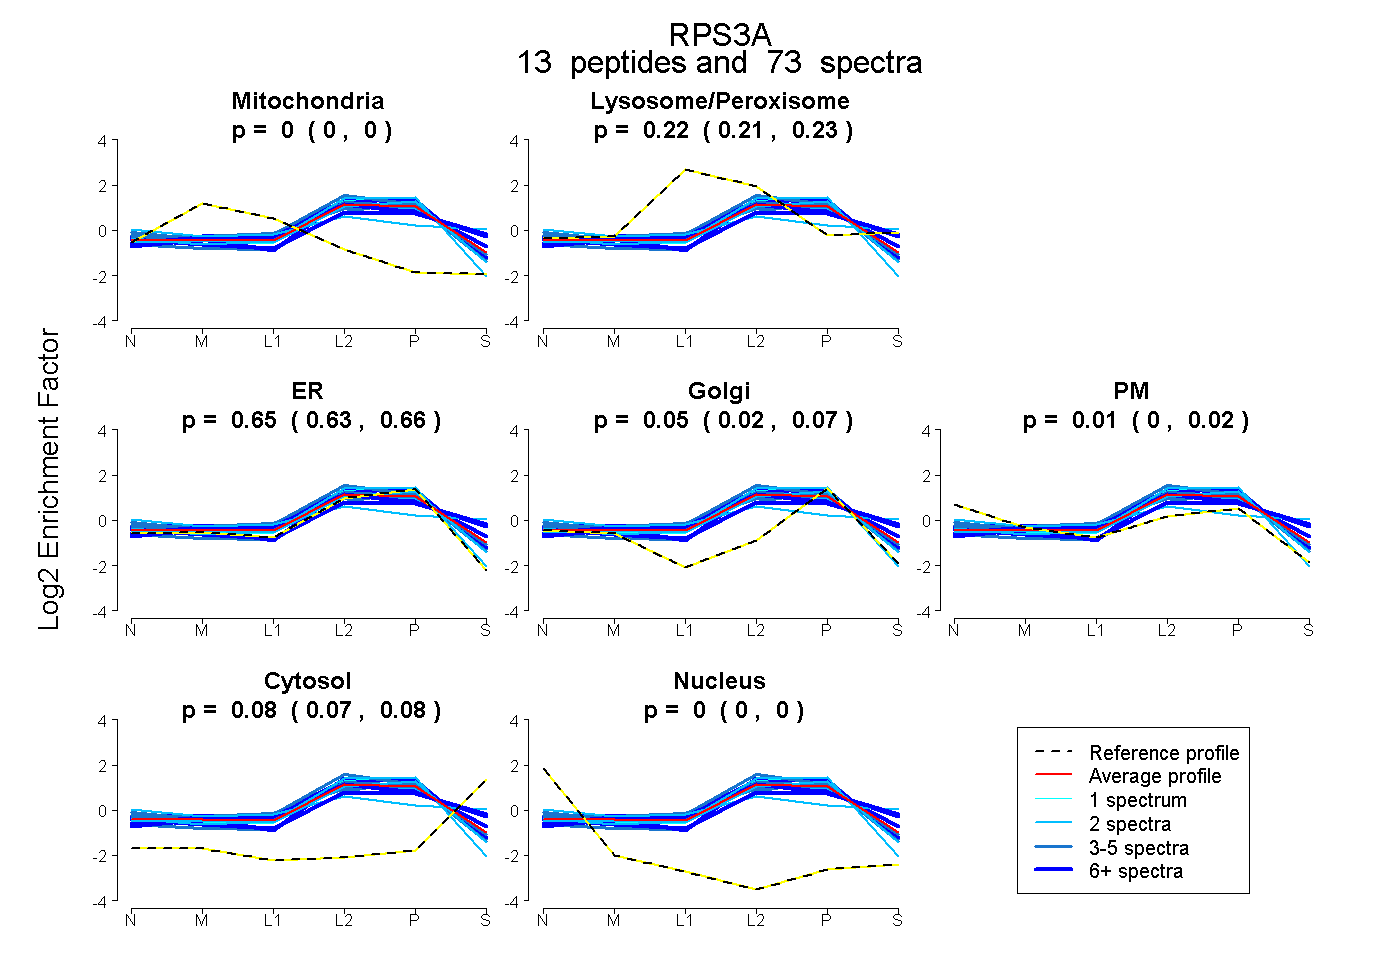
0.000 | 0.000
0.206 | 0.226
0.627 | 0.664
0.022 | 0.065
0.000 | 0.022
0.073 | 0.085
0.000 | 0.000