 7
7peptides
spectra
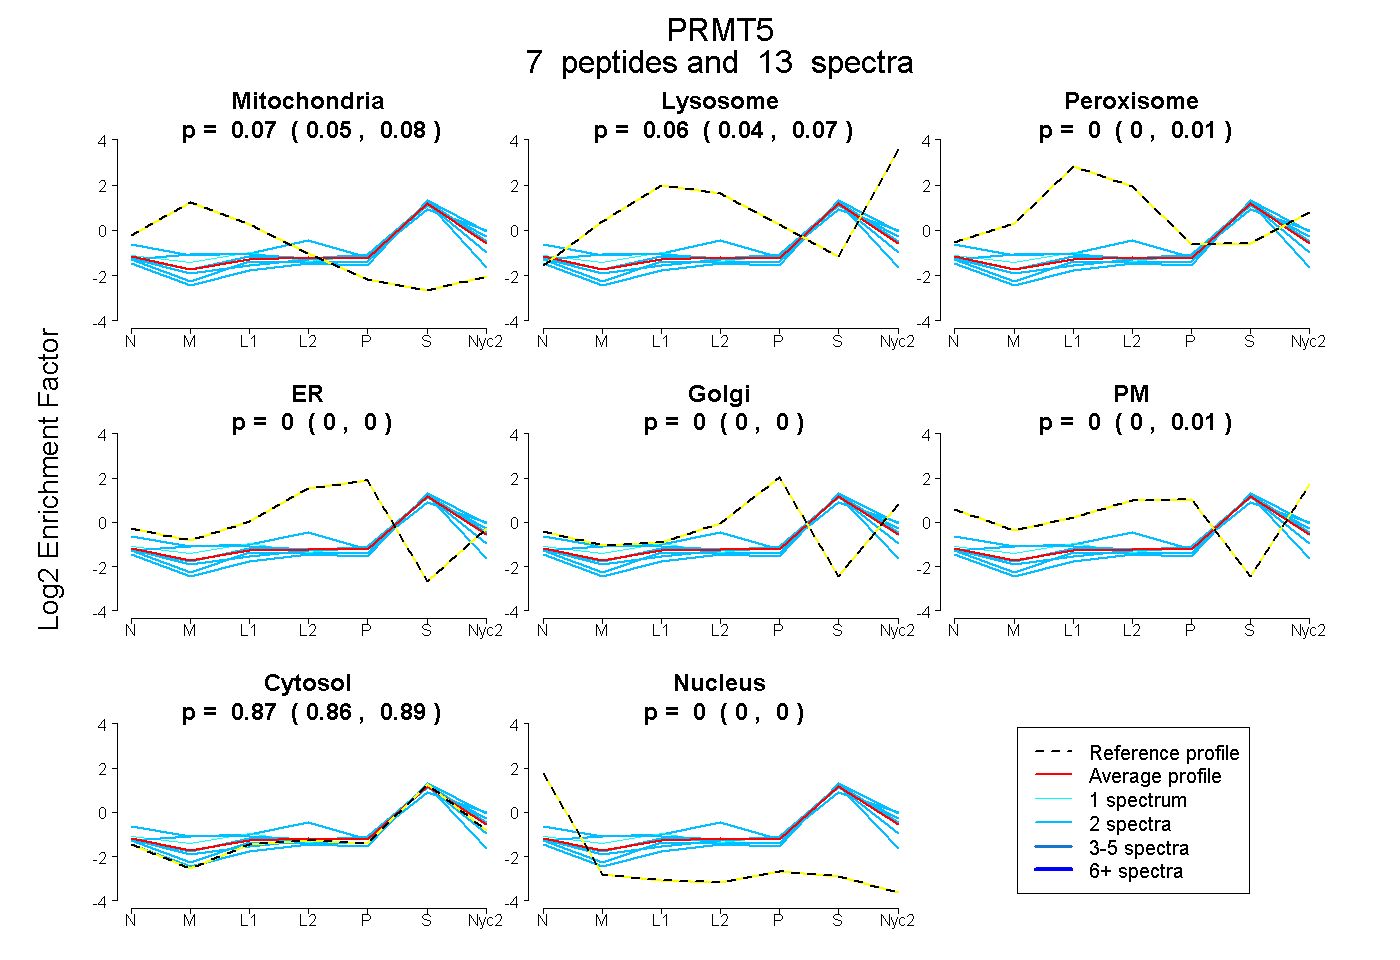
0.049 | 0.081
0.039 | 0.073
0.000 | 0.005
0.000 | 0.000
0.000 | 0.000
0.000 | 0.009
0.857 | 0.885
0.000 | 0.000
1peptide
spectrum
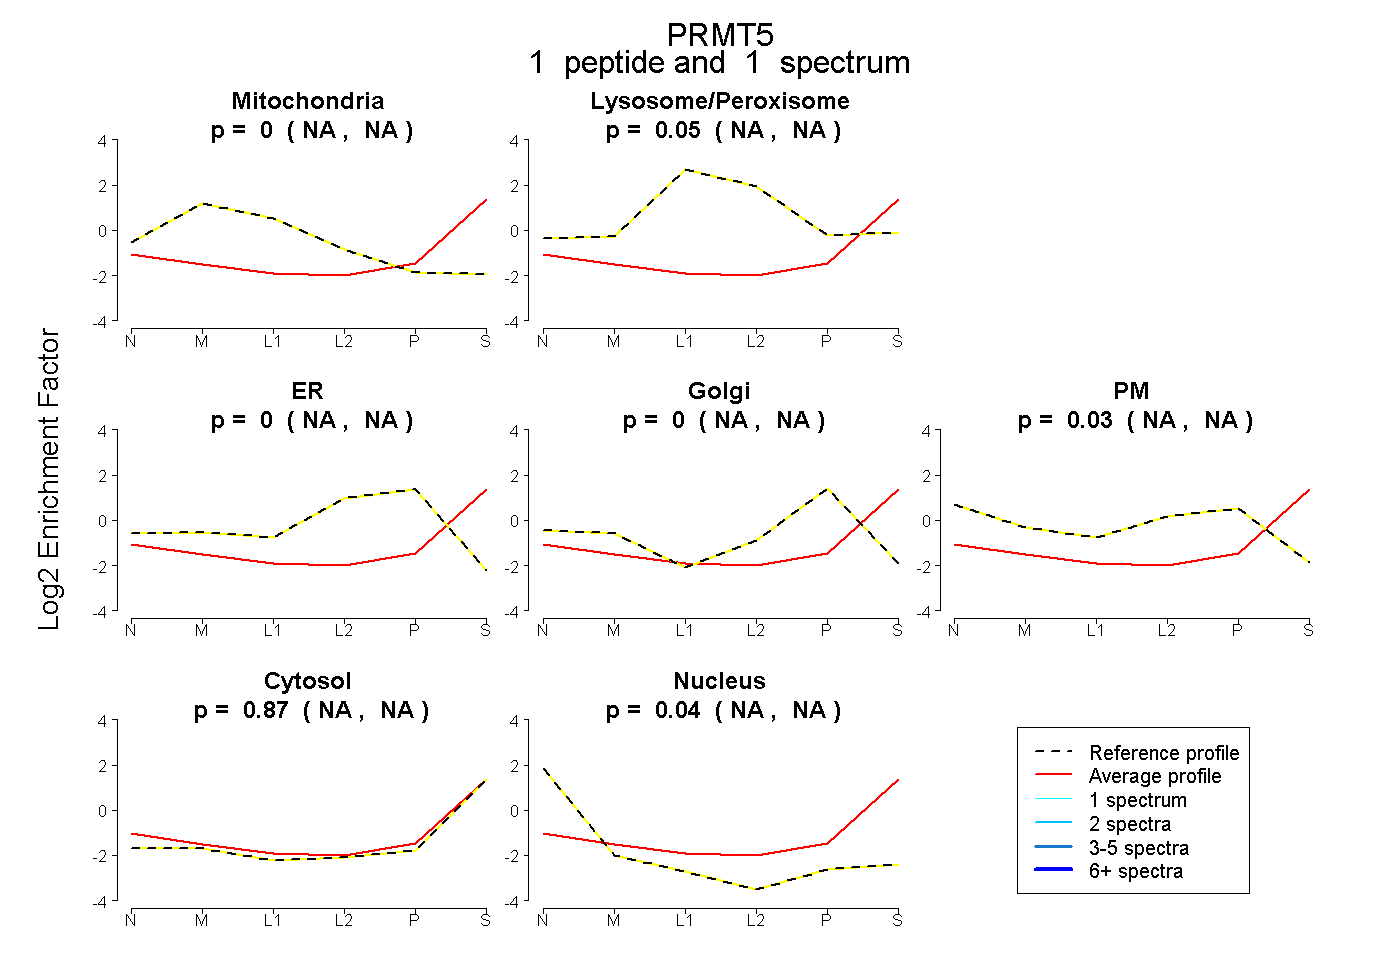
NA | NA
NA | NA
NA | NA
NA | NA
NA | NA
NA | NA
NA | NA
6peptides
spectra
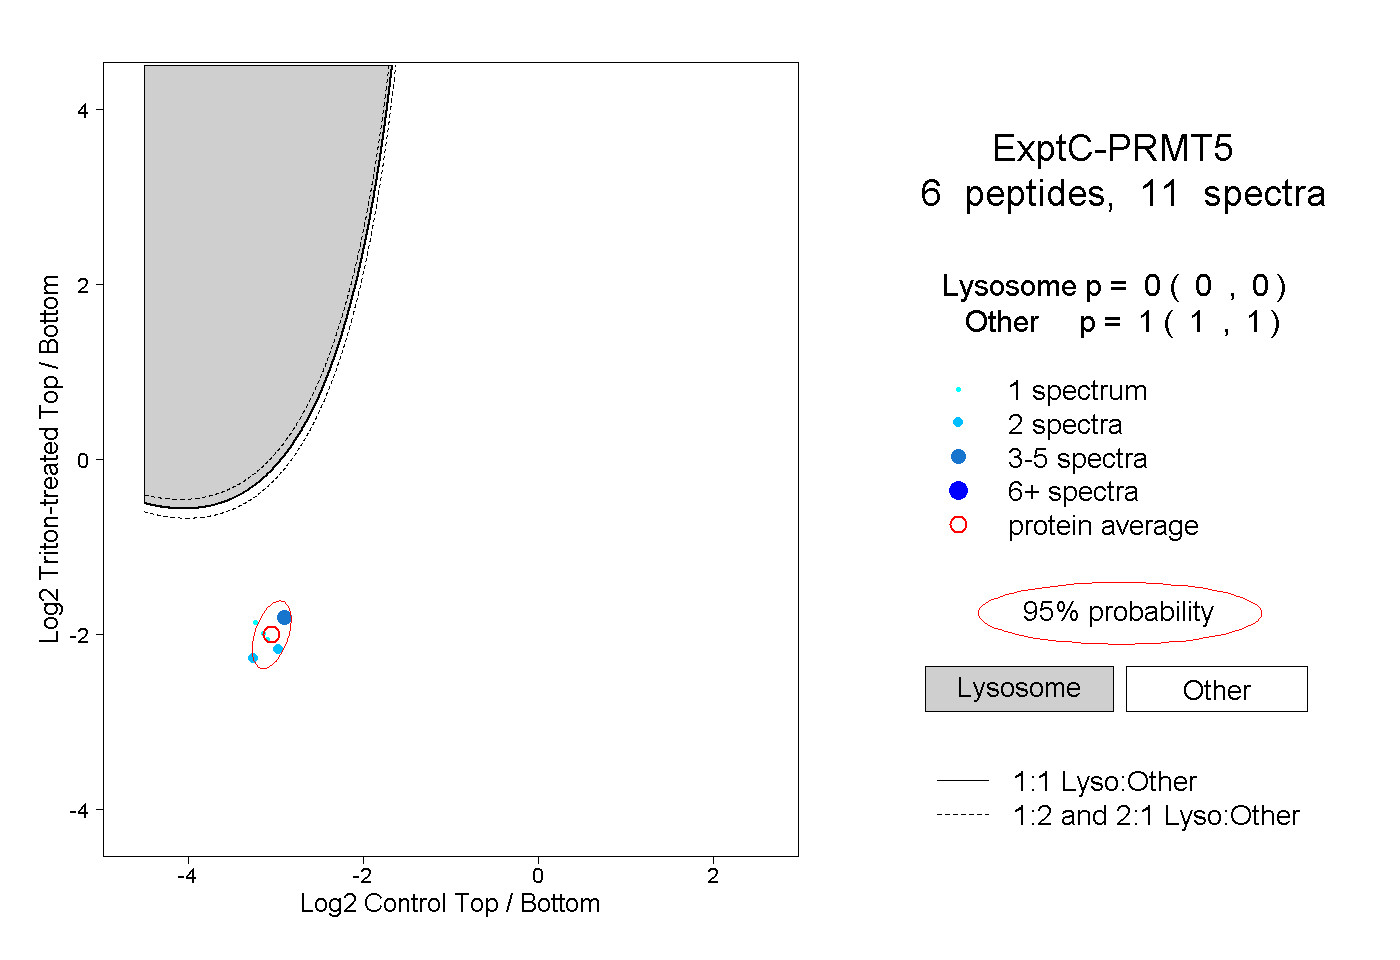
0.000 | 0.000
1.000 | 1.000