 38
38peptides
spectra
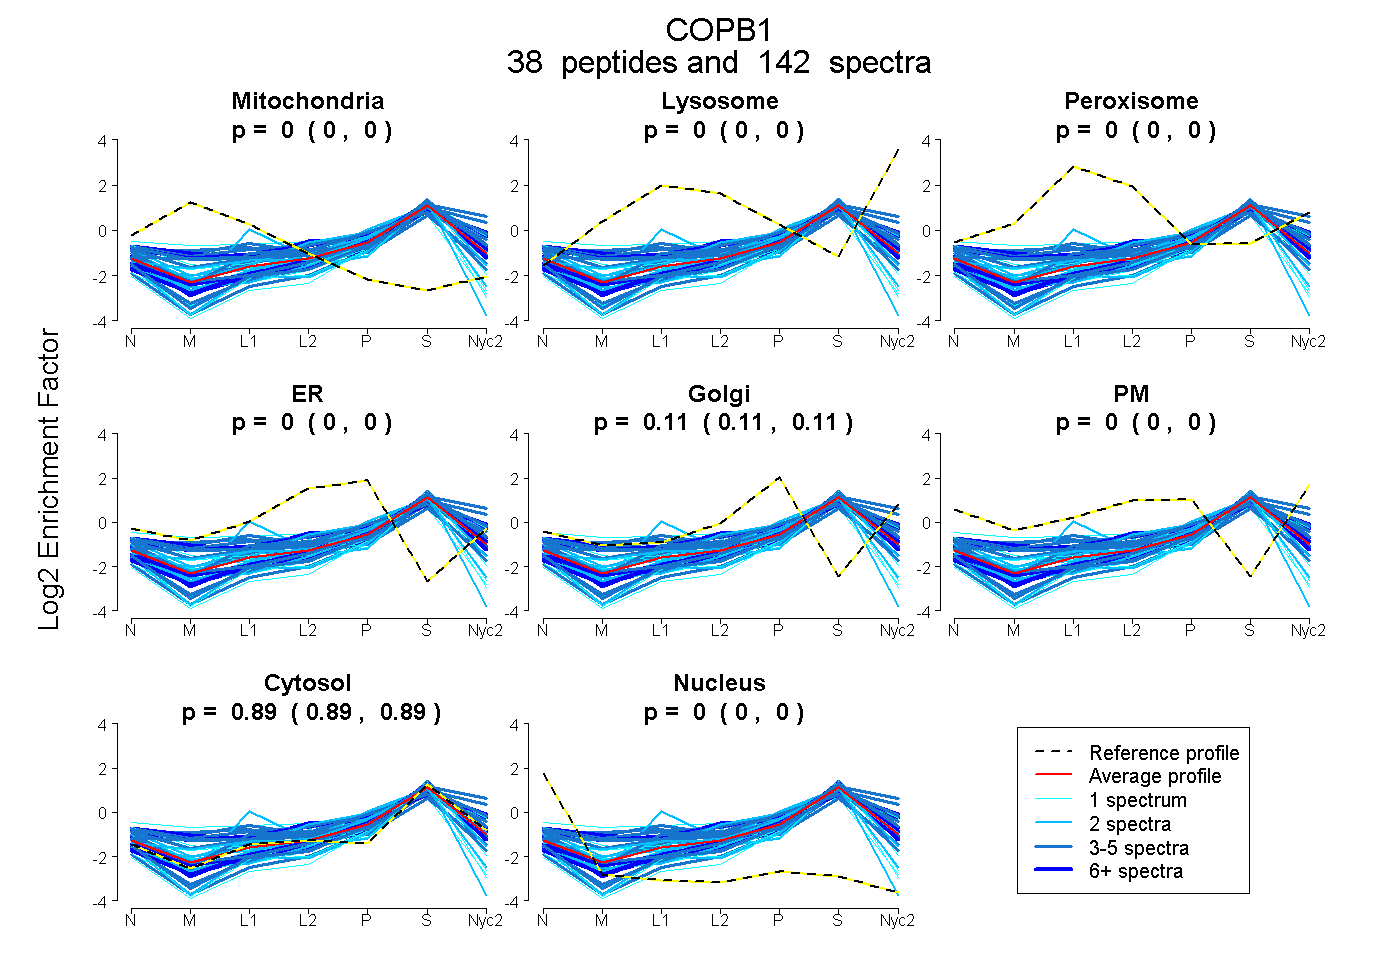
0.000 | 0.000
0.000 | 0.000
0.000 | 0.000
0.000 | 0.000
0.108 | 0.112
0.000 | 0.000
0.886 | 0.889
0.000 | 0.003
20peptides
spectra
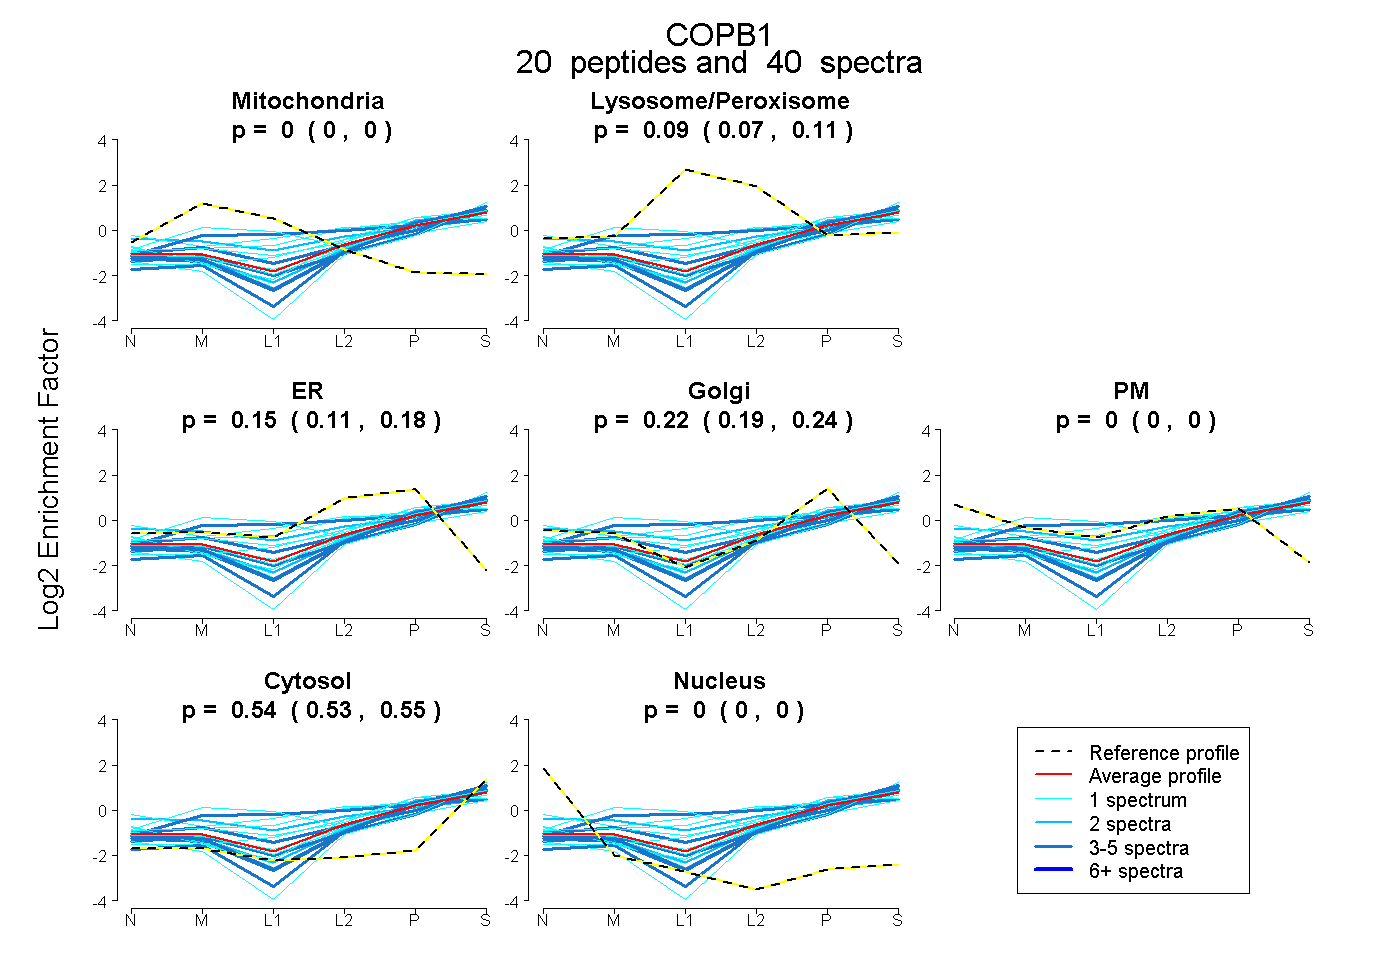
0.000 | 0.000
0.071 | 0.110
0.110 | 0.180
0.188 | 0.243
0.000 | 0.000
0.529 | 0.550
0.000 | 0.000
24peptides
spectra
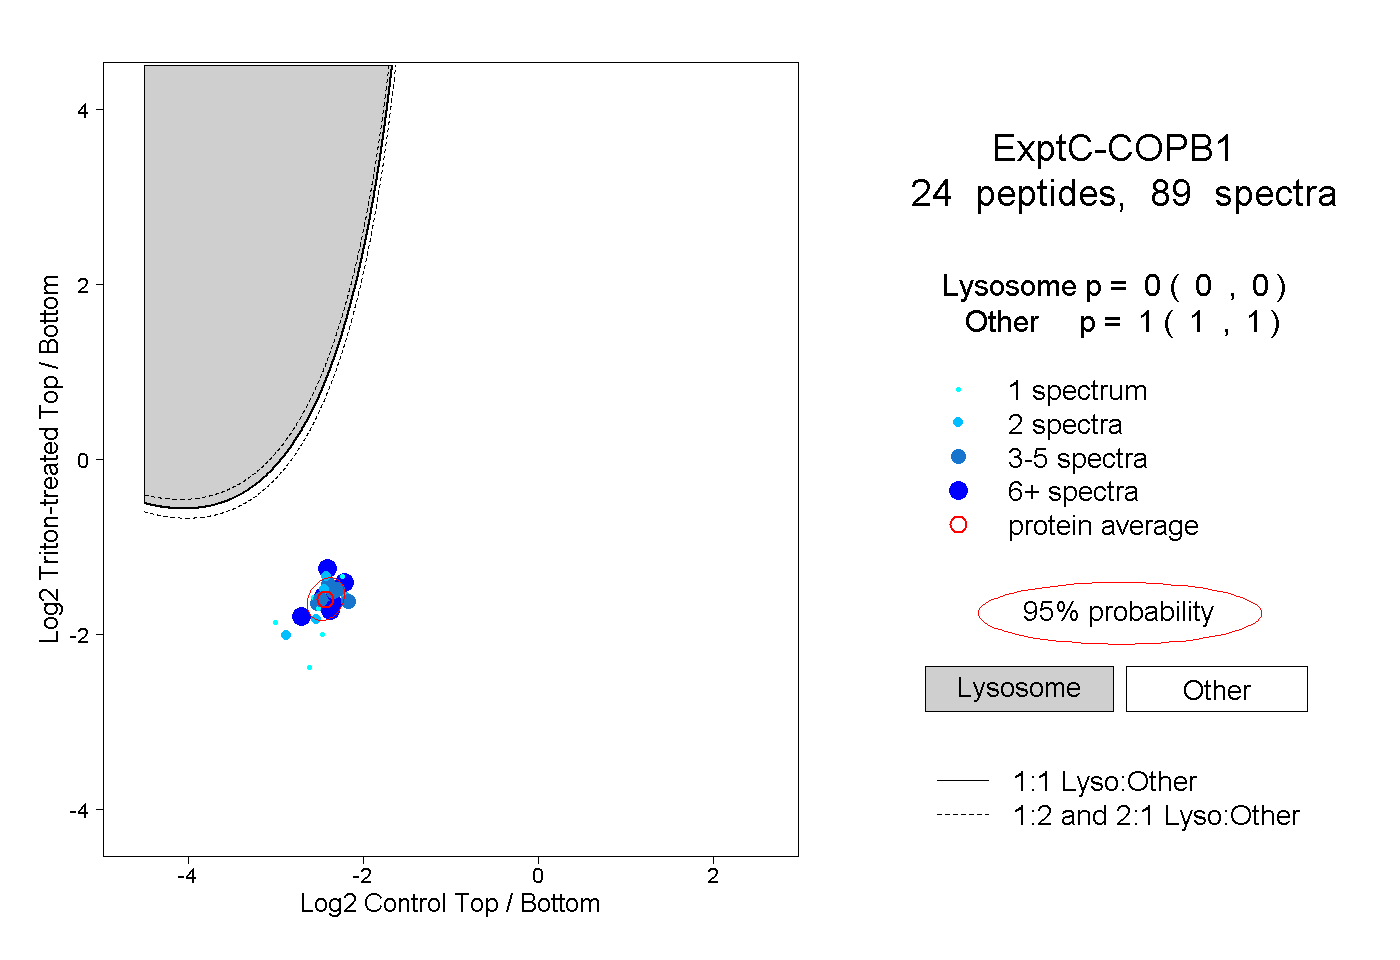
0.000 | 0.000
1.000 | 1.000
7peptides
spectra
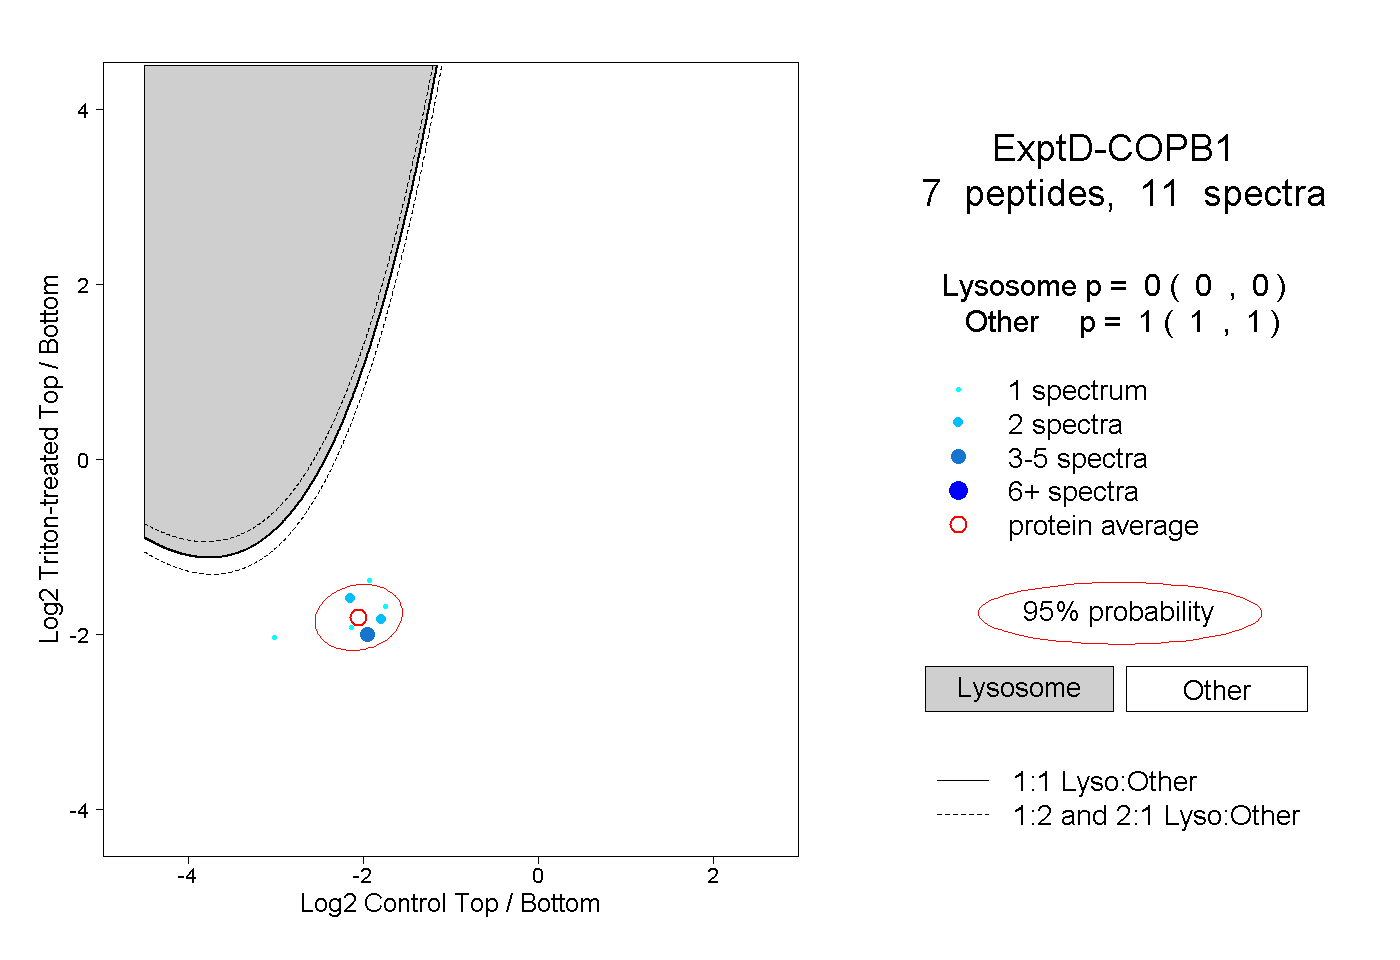
0.000 | 0.000
1.000 | 1.000