 5
5peptides
spectra
0.000 | 0.000
0.000 | 0.000
0.000 | 0.000
0.000 | 0.022
0.000 | 0.006
0.478 | 0.518
0.477 | 0.501
0.000 | 0.000
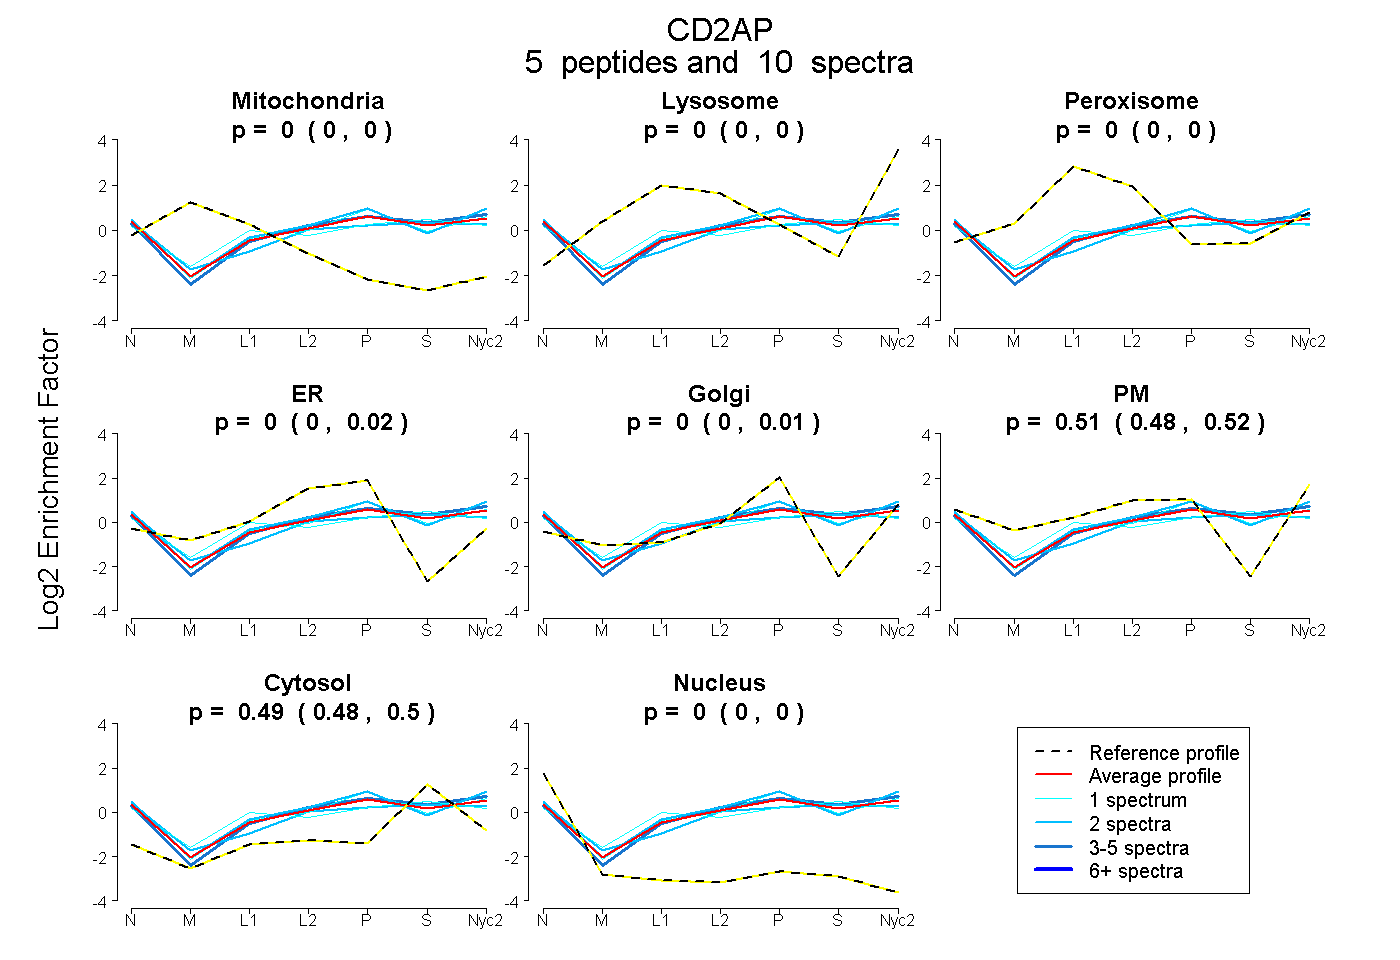
| Plot | Mito | Lyso | Perox | ER | Golgi | PM | Cytosol | Nucleus | |||||
| Expt A |
5 peptides |
10 spectra |
|
0.000 0.000 | 0.000 |
0.000 0.000 | 0.000 |
0.000 0.000 | 0.000 |
0.000 0.000 | 0.022 |
0.000 0.000 | 0.006 |
0.509 0.478 | 0.518 |
0.491 0.477 | 0.501 |
0.000 0.000 | 0.000 |
| 2 spectra, SVDLDALVAR | 0.000 | 0.000 | 0.000 | 0.000 | 0.045 | 0.562 | 0.393 | 0.000 | ||
| 2 spectra, ERPGNVASLVQR | 0.000 | 0.000 | 0.000 | 0.000 | 0.000 | 0.450 | 0.550 | 0.000 | ||
| 1 spectrum, LDPEQLPVRPK | 0.000 | 0.000 | 0.000 | 0.000 | 0.114 | 0.458 | 0.428 | 0.000 | ||
| 1 spectrum, KPTPPTK | 0.000 | 0.000 | 0.136 | 0.000 | 0.000 | 0.346 | 0.517 | 0.000 | ||
| 4 spectra, EGEIIHLISK | 0.000 | 0.000 | 0.000 | 0.000 | 0.000 | 0.490 | 0.510 | 0.000 |
| Plot | Mito | Lyso or Perox | ER | Golgi | PM | Cytosol | Nucleus | ||||||
| Expt B |
4 peptides |
7 spectra |
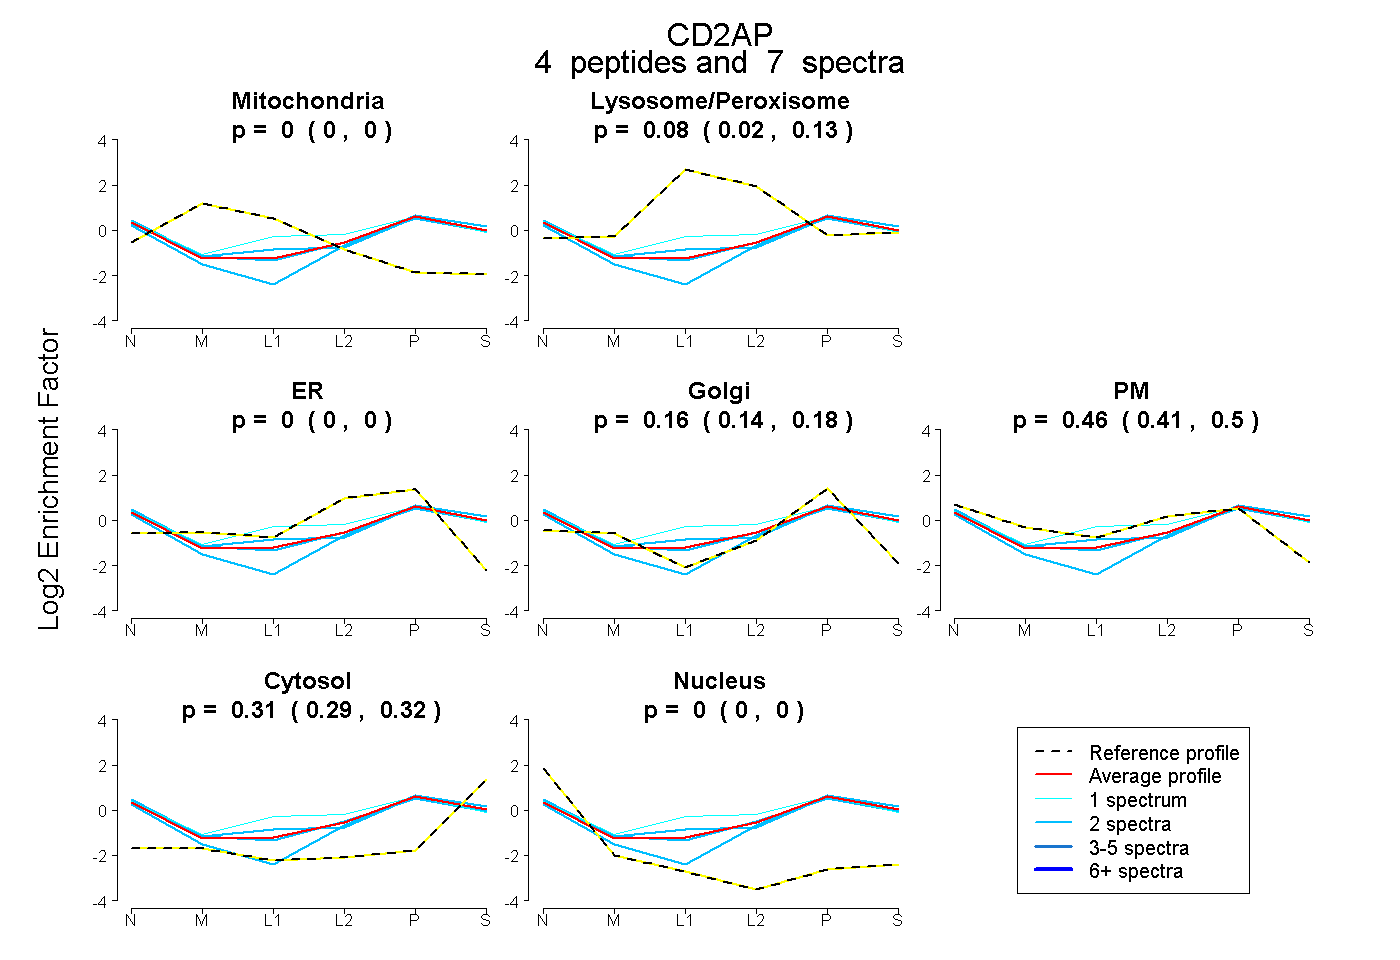 |
0.000 0.000 | 0.000 |
0.077 0.022 | 0.125 |
0.000 0.000 | 0.000 |
0.160 0.140 | 0.177 |
0.457 0.408 | 0.496 |
0.306 0.287 | 0.321 |
0.000 0.000 | 0.000 |
|||
| Plot | Lyso | Other | |||||||||||
| Expt C |
11 peptides |
24 spectra |
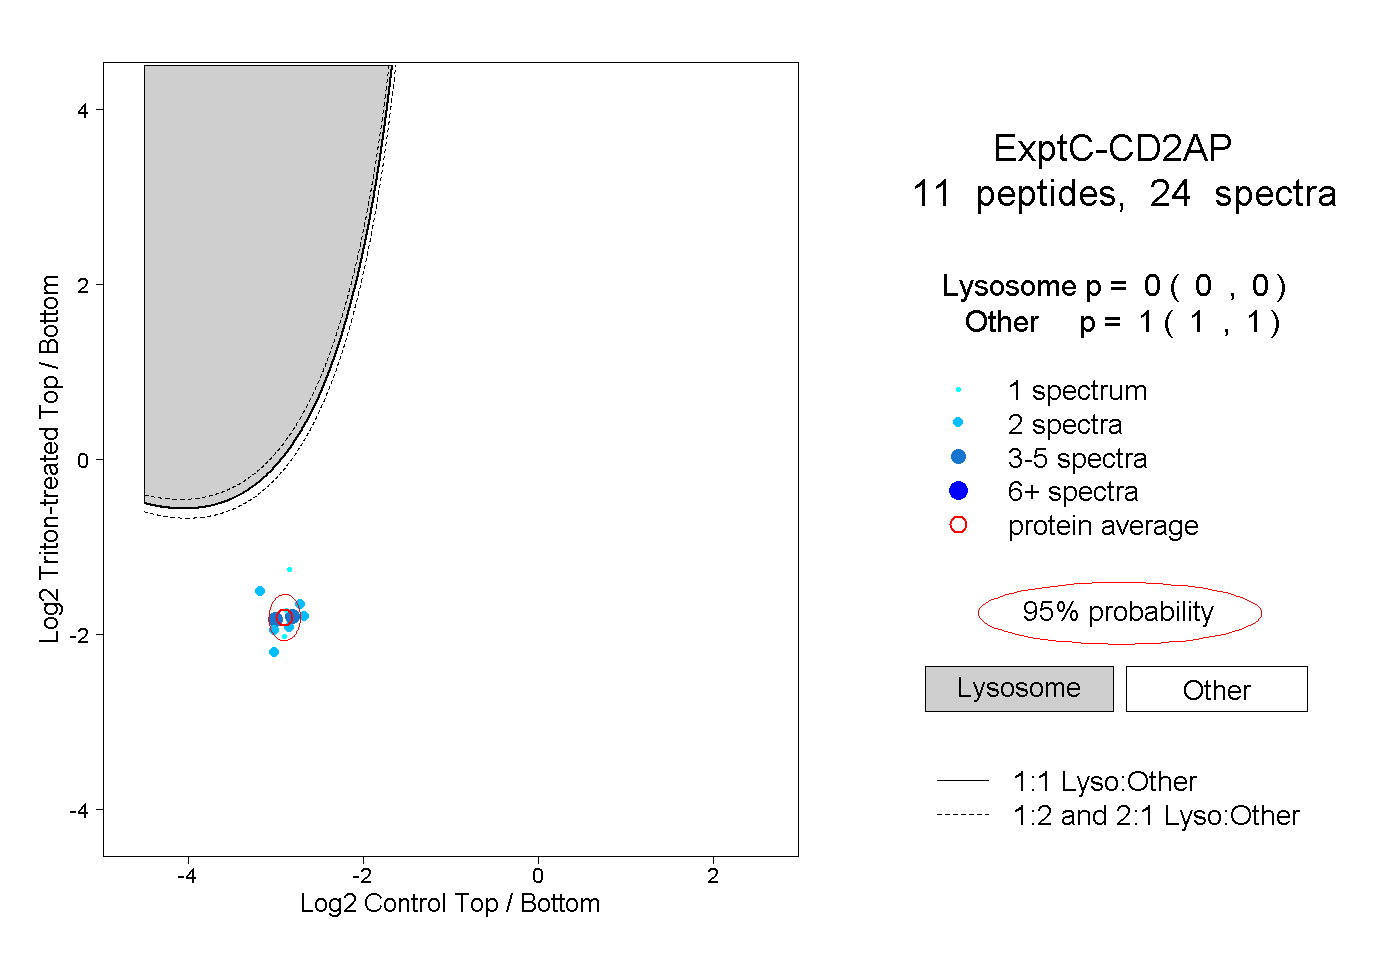 |
0.000 0.000 | 0.000 |
1.000 1.000 | 1.000 |
||||||||
| Plot | Lyso | Other | |||||||||||
| Expt D |
1 peptide |
1 spectrum |
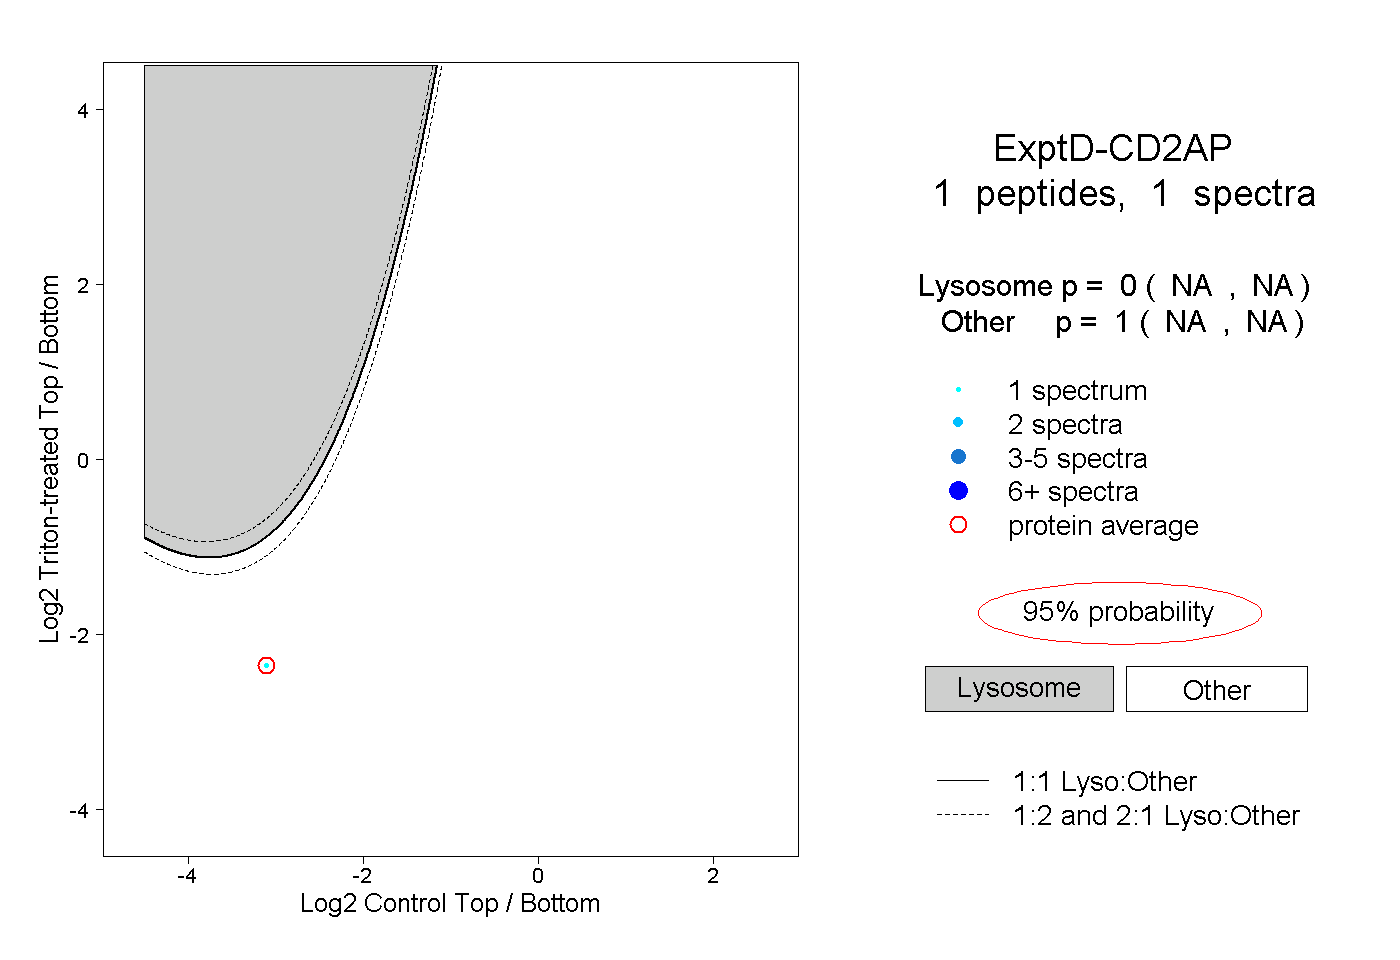 |
0.000 NA | NA |
1.000 NA | NA |