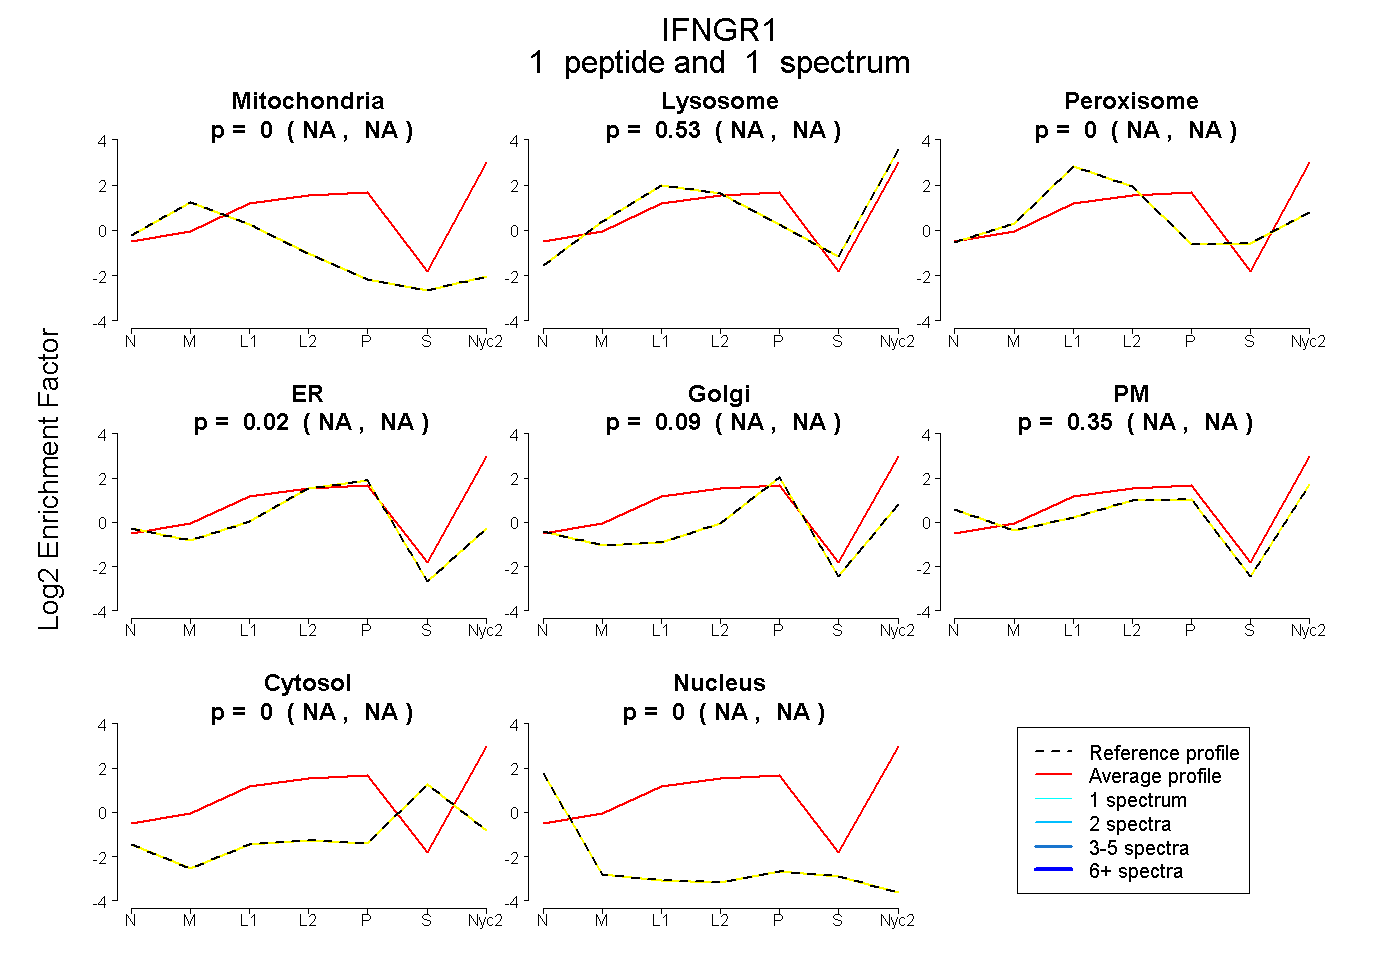
 1
1peptide
spectrum
NA | NA
NA | NA
NA | NA
NA | NA
NA | NA
NA | NA
NA | NA
NA | NA
| Plot | Mito | Lyso | Perox | ER | Golgi | PM | Cytosol | Nucleus | |||||
| Expt A |
1 peptide |
1 spectrum |
|
0.000 NA | NA |
0.535 NA | NA |
0.000 NA | NA |
0.023 NA | NA |
0.089 NA | NA |
0.353 NA | NA |
0.000 NA | NA |
0.000 NA | NA |
| 1 spectrum, EDQLIVHIFHPK | 0.000 | 0.535 | 0.000 | 0.023 | 0.089 | 0.353 | 0.000 | 0.000 |
| Plot | Lyso | Other | |||||||||||
| Expt C |
5 peptides |
11 spectra |
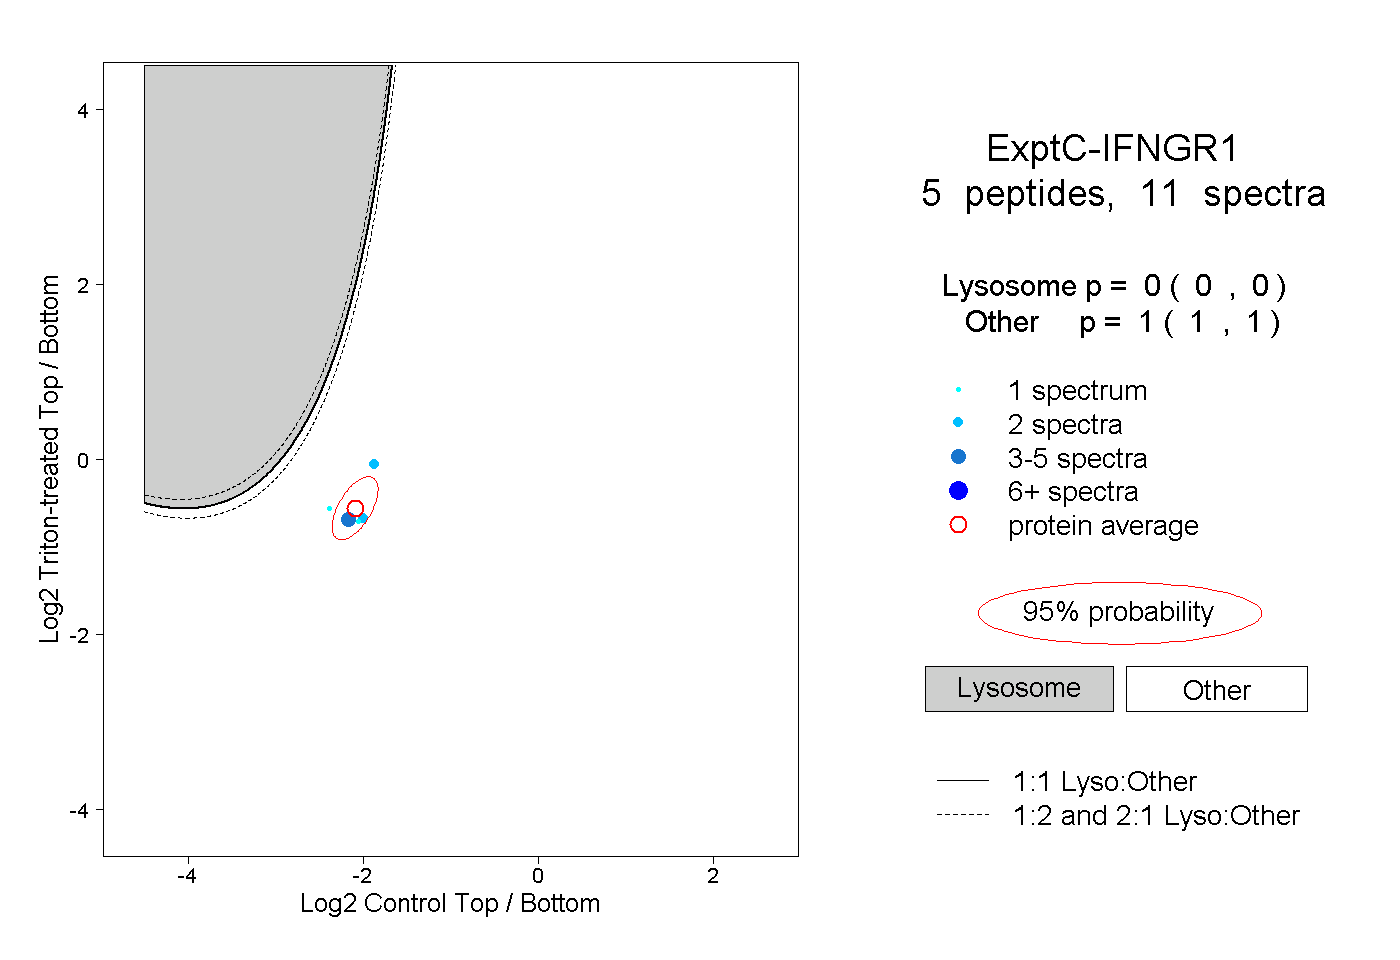 |
0.000 0.000 | 0.000 |
1.000 1.000 | 1.000 |