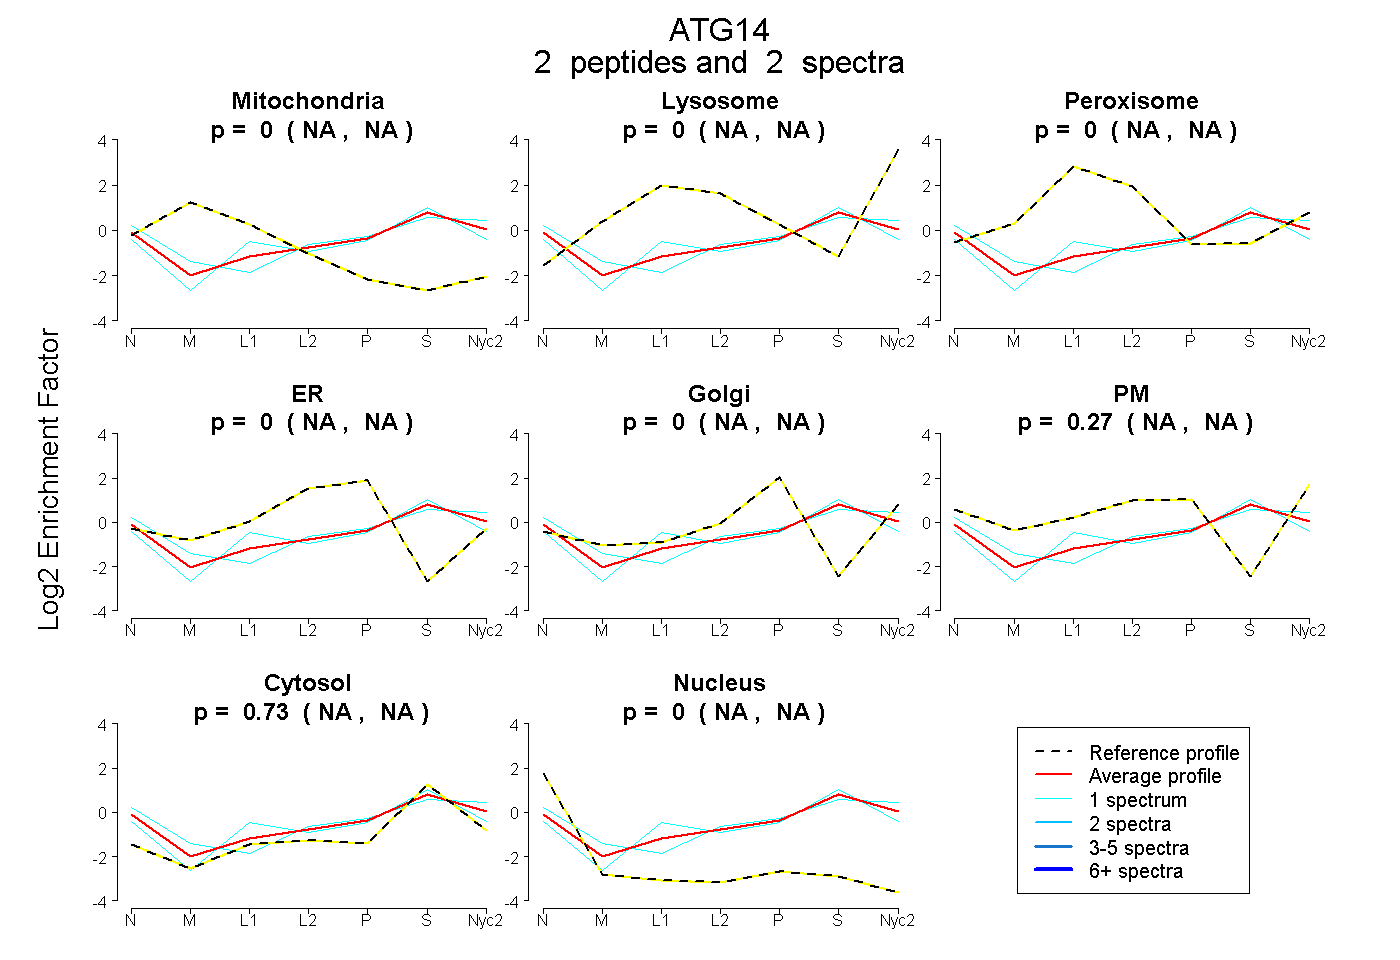
 2
2peptides
spectra
NA | NA
NA | NA
NA | NA
NA | NA
NA | NA
NA | NA
NA | NA
NA | NA
| Plot | Mito | Lyso | Perox | ER | Golgi | PM | Cytosol | Nucleus | |||||
| Expt A |
2 peptides |
2 spectra |
|
0.000 NA | NA |
0.000 NA | NA |
0.000 NA | NA |
0.000 NA | NA |
0.000 NA | NA |
0.274 NA | NA |
0.726 NA | NA |
0.000 NA | NA |
| 1 spectrum, LAEAR | 0.000 | 0.000 | 0.054 | 0.000 | 0.000 | 0.152 | 0.794 | 0.000 | ||
| 1 spectrum, CPLCNTTR | 0.000 | 0.000 | 0.000 | 0.000 | 0.000 | 0.350 | 0.633 | 0.017 |