 3
3peptides
spectra
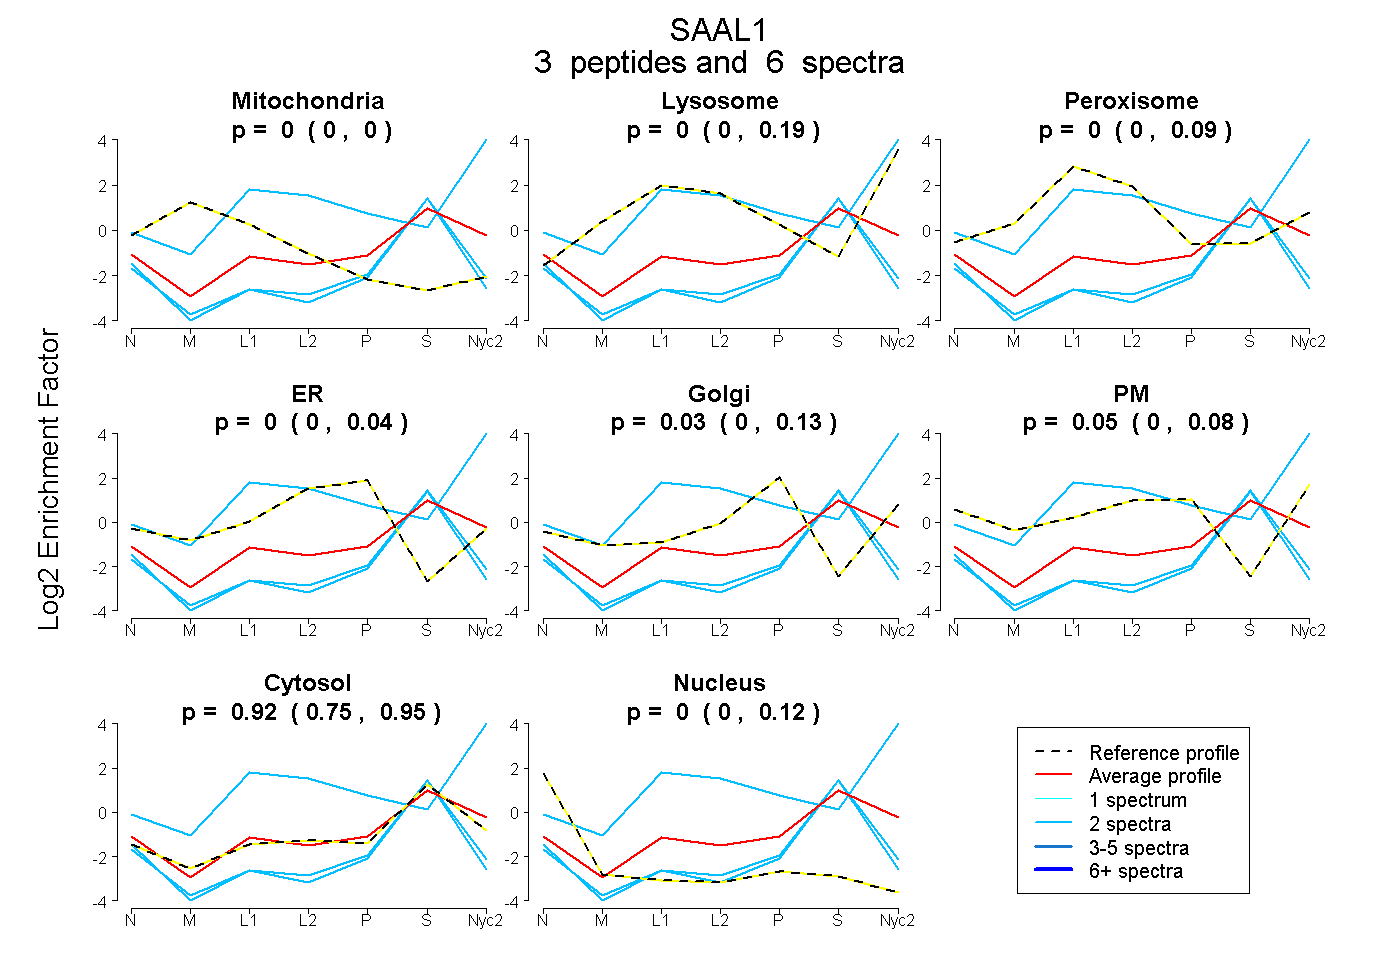
0.000 | 0.000
0.000 | 0.189
0.000 | 0.093
0.000 | 0.044
0.000 | 0.134
0.000 | 0.079
0.746 | 0.950
0.000 | 0.117
3peptides
spectra
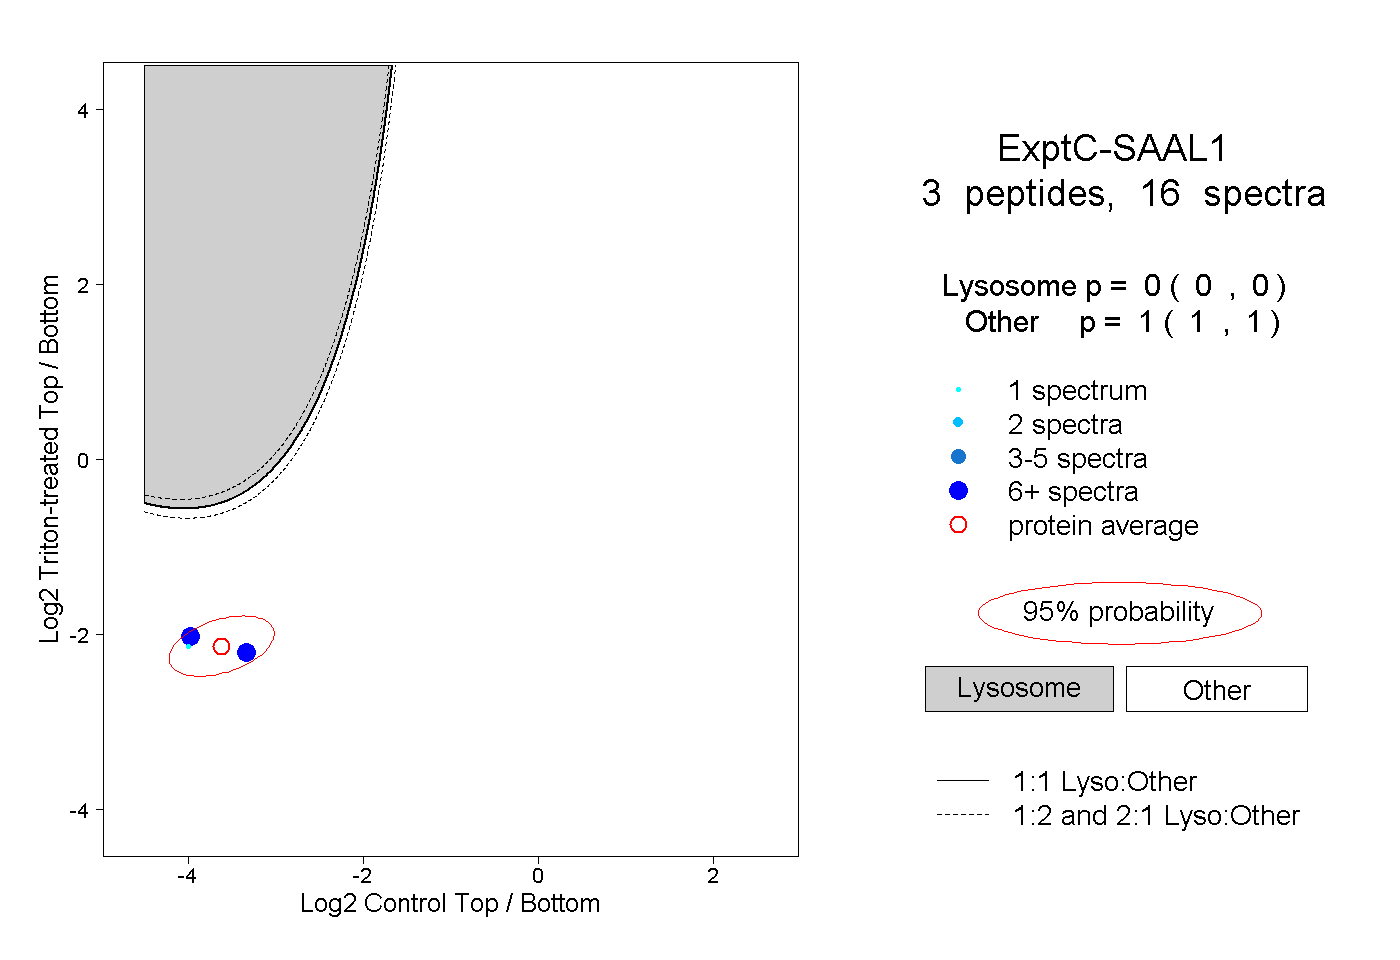
0.000 | 0.000
1.000 | 1.000
| Plot | Mito | Lyso | Perox | ER | Golgi | PM | Cytosol | Nucleus | |||||
| Expt A |
3 peptides |
6 spectra |
|
0.000 0.000 | 0.000 |
0.000 0.000 | 0.189 |
0.000 0.000 | 0.093 |
0.000 0.000 | 0.044 |
0.028 0.000 | 0.134 |
0.049 0.000 | 0.079 |
0.923 0.746 | 0.950 |
0.000 0.000 | 0.117 |
||
| Plot | Lyso | Other | |||||||||||
| Expt C |
3 peptides |
16 spectra |
|
0.000 0.000 | 0.000 |
1.000 1.000 | 1.000 |