6
6peptides
spectra
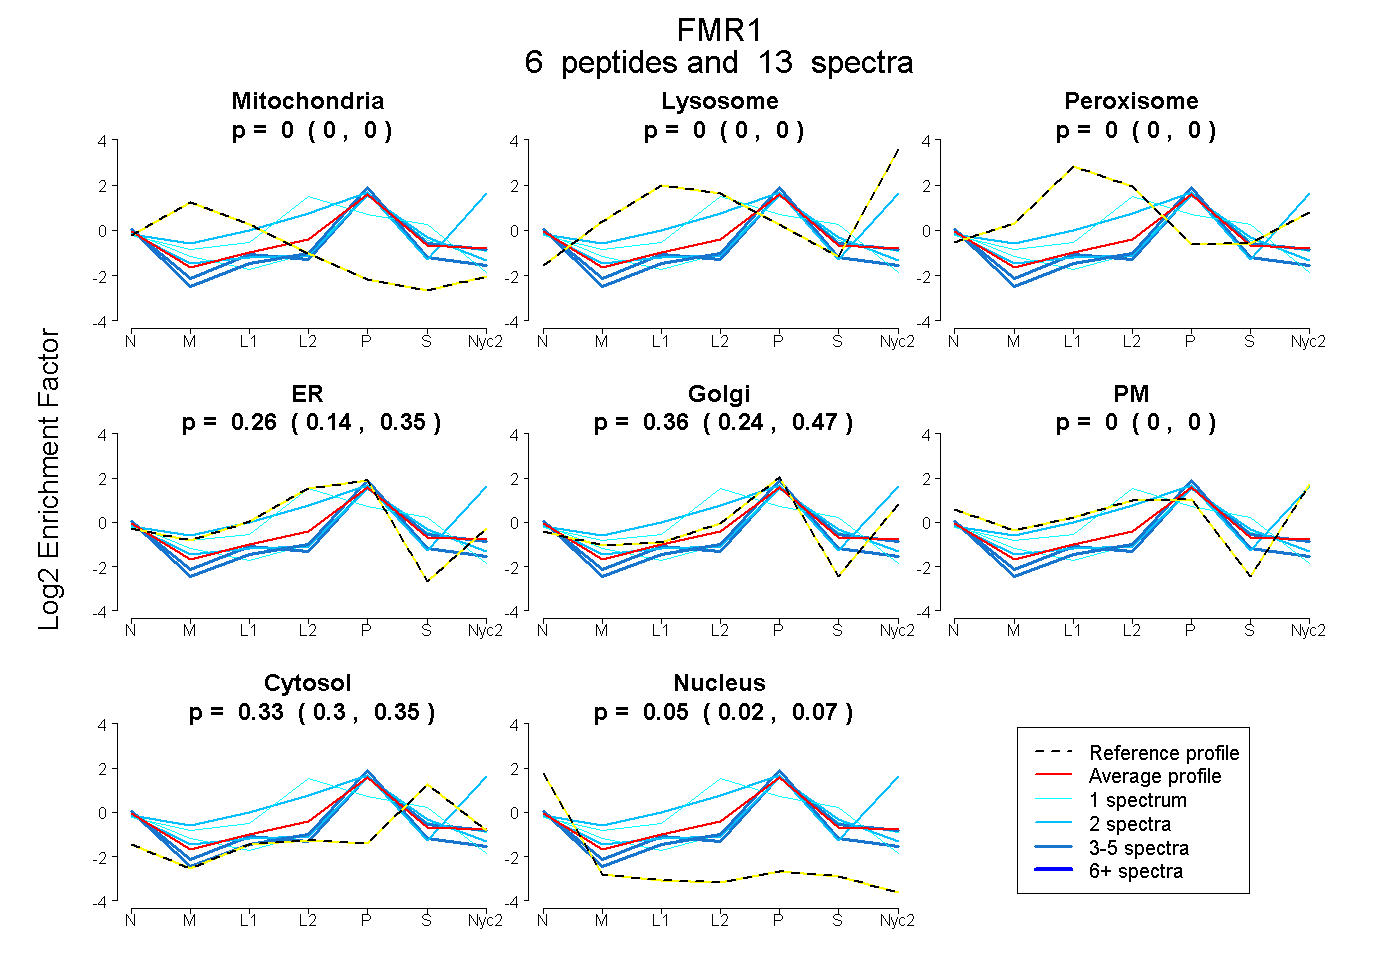
0.000 | 0.000
0.000 | 0.000
0.000 | 0.000
0.139 | 0.350
0.244 | 0.474
0.000 | 0.000
0.302 | 0.346
0.022 | 0.073
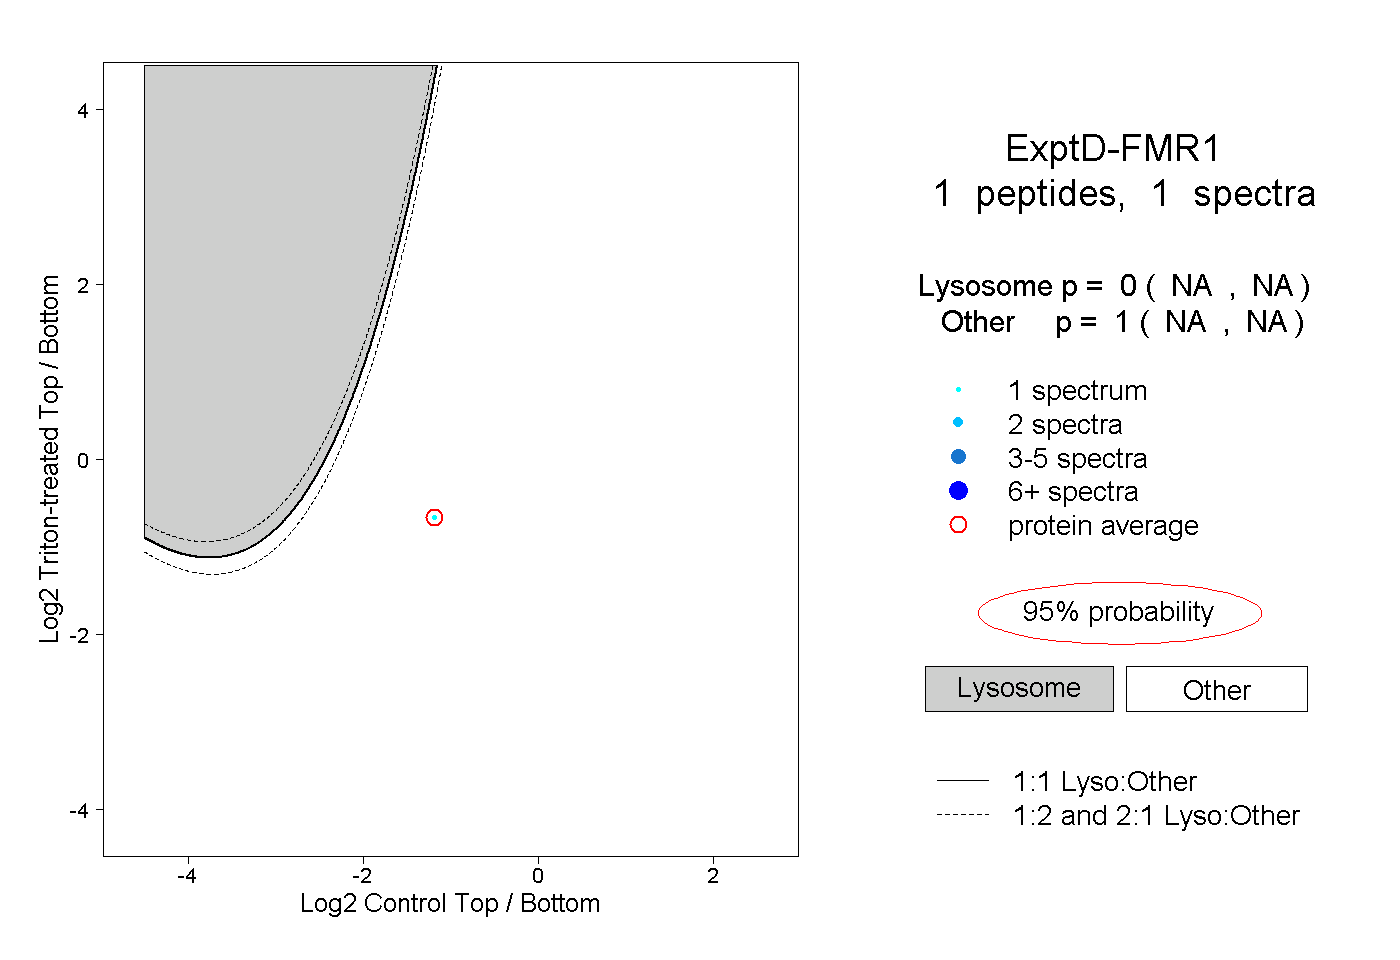
1peptide
spectrum
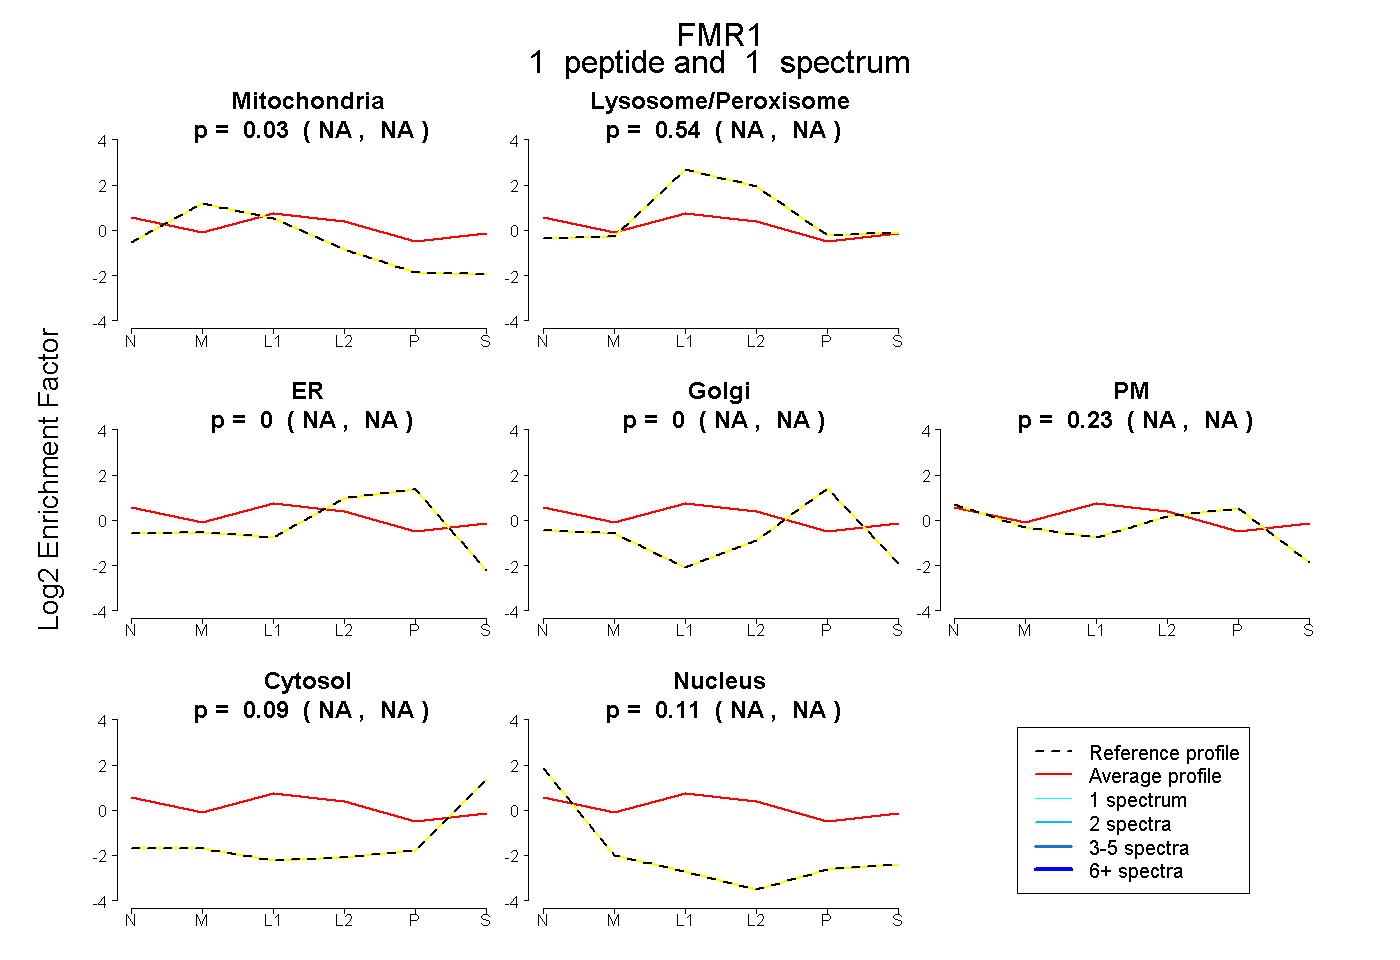
NA | NA
NA | NA
NA | NA
NA | NA
NA | NA
NA | NA
NA | NA
4peptides
spectra
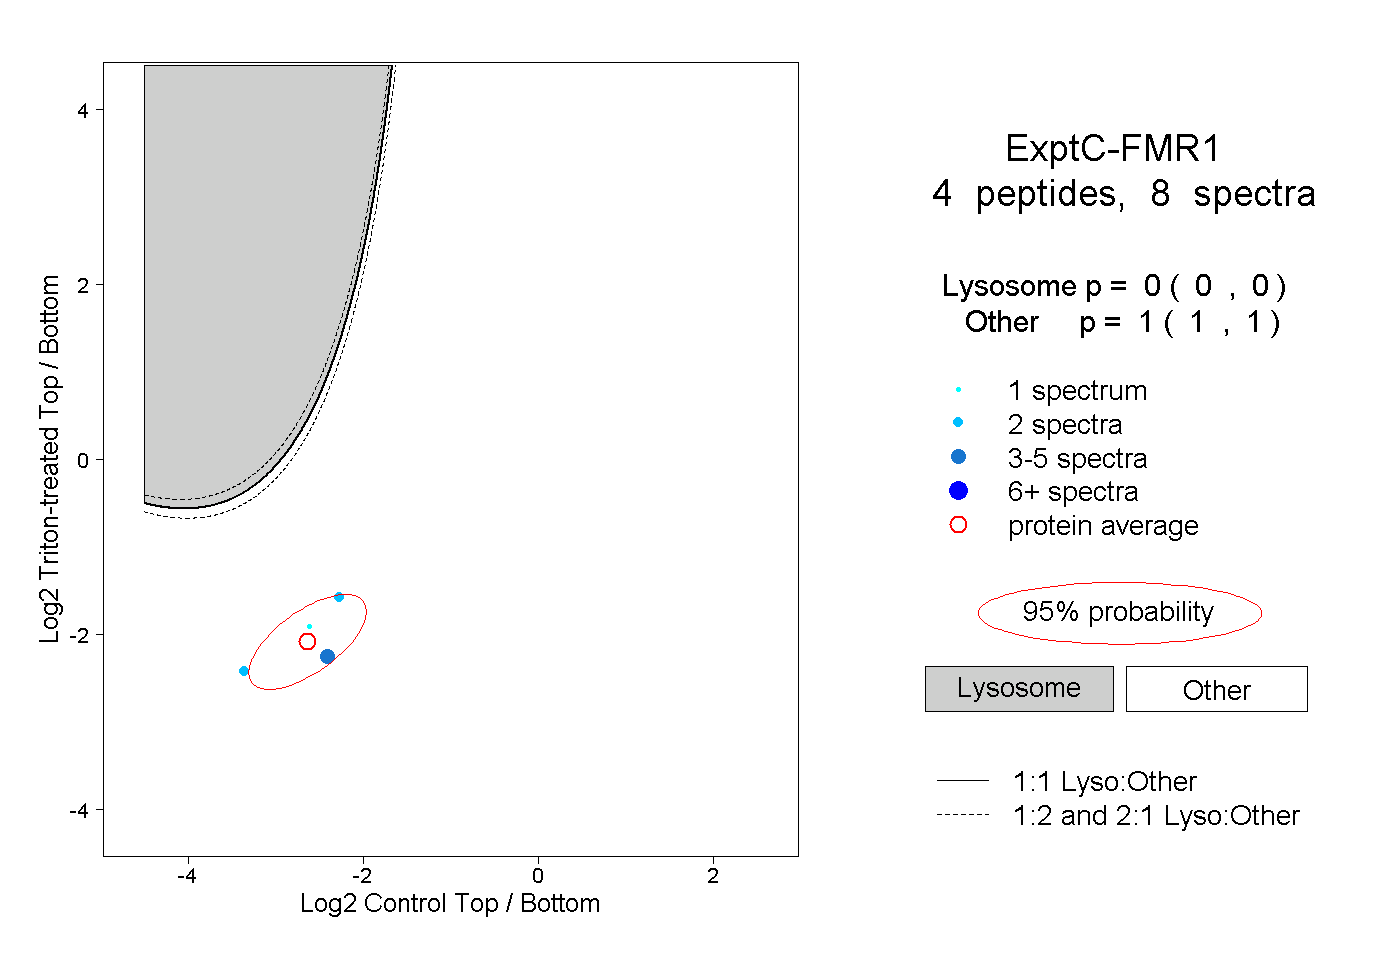
0.000 | 0.000
1.000 | 1.000