 6
6peptides
spectra
0.000 | 0.000
0.000 | 0.000
0.000 | 0.000
0.139 | 0.350
0.244 | 0.474
0.000 | 0.000
0.302 | 0.346
0.022 | 0.073
| Plot | Mito | Lyso | Perox | ER | Golgi | PM | Cytosol | Nucleus | |||||
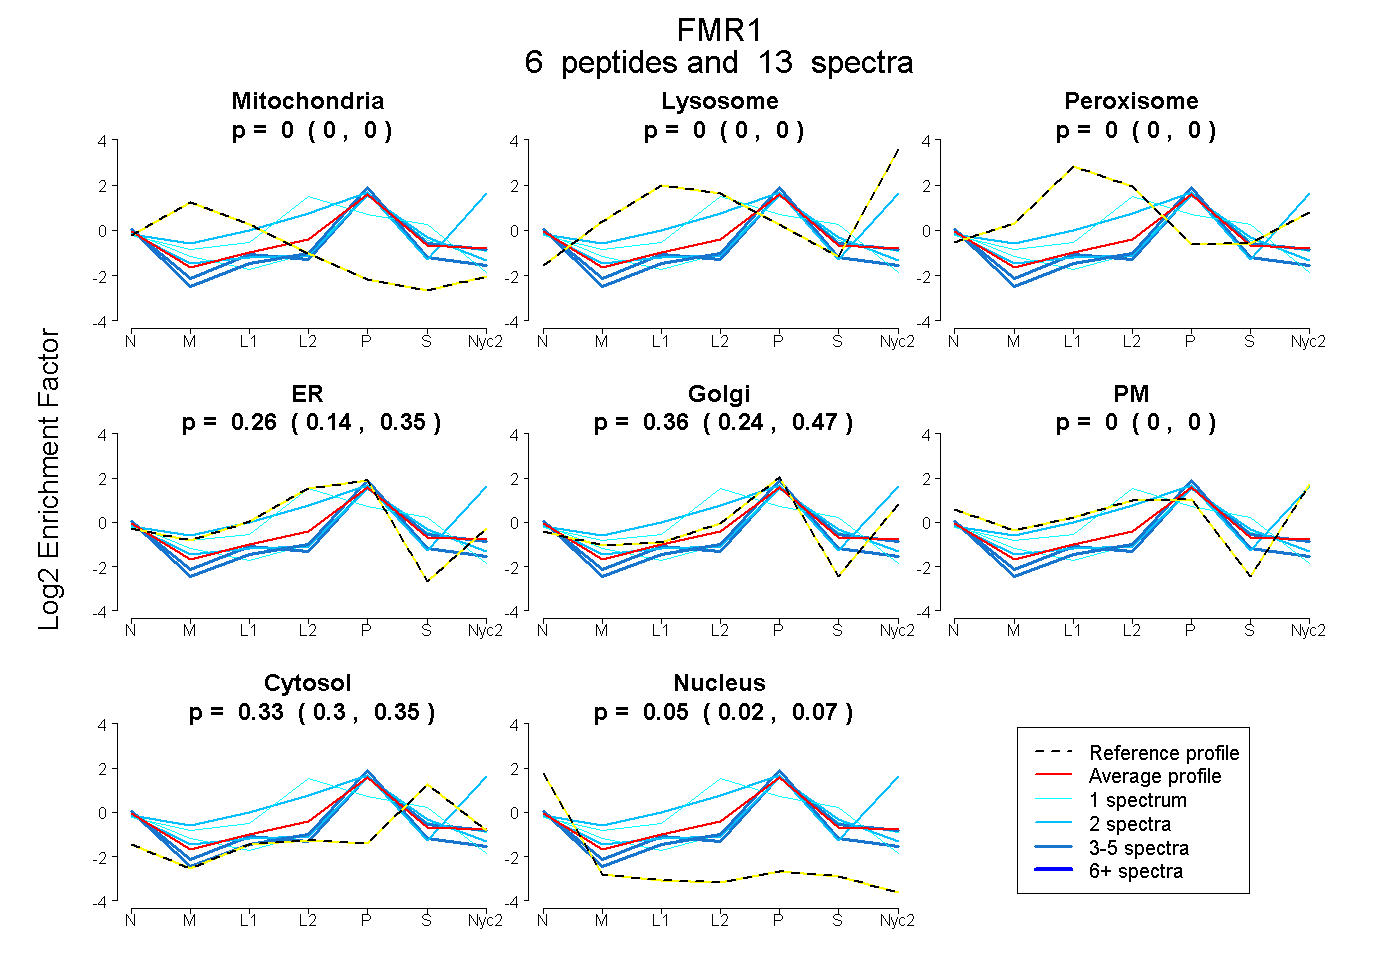
| Expt A |
6 peptides |
13 spectra |
|
0.000 0.000 | 0.000 |
0.000 0.000 | 0.000 |
0.000 0.000 | 0.000 |
0.258 0.139 | 0.350 |
0.365 0.244 | 0.474 |
0.000 0.000 | 0.000 |
0.327 0.302 | 0.346 |
0.050 0.022 | 0.073 |
| 4 spectra, QIGASSRPPPNR | 0.000 | 0.000 | 0.000 | 0.119 | 0.475 | 0.000 | 0.204 | 0.201 | ||
| 1 spectrum, AHMLIDMHFR | 0.000 | 0.000 | 0.000 | 0.000 | 0.584 | 0.000 | 0.324 | 0.092 | ||
| 2 spectra, QIPFHDVR | 0.000 | 0.221 | 0.021 | 0.000 | 0.456 | 0.253 | 0.051 | 0.000 | ||
| 2 spectra, LIQEIVDK | 0.000 | 0.000 | 0.000 | 0.129 | 0.402 | 0.000 | 0.378 | 0.091 | ||
| 1 spectrum, TTDGSLQSTSSEGSR | 0.000 | 0.000 | 0.102 | 0.504 | 0.000 | 0.000 | 0.394 | 0.000 | ||
| 3 spectra, EVDQLR | 0.000 | 0.000 | 0.000 | 0.000 | 0.565 | 0.000 | 0.334 | 0.100 |
| Plot | Mito | Lyso or Perox | ER | Golgi | PM | Cytosol | Nucleus | ||||||
| Expt B |
1 peptide |
1 spectrum |
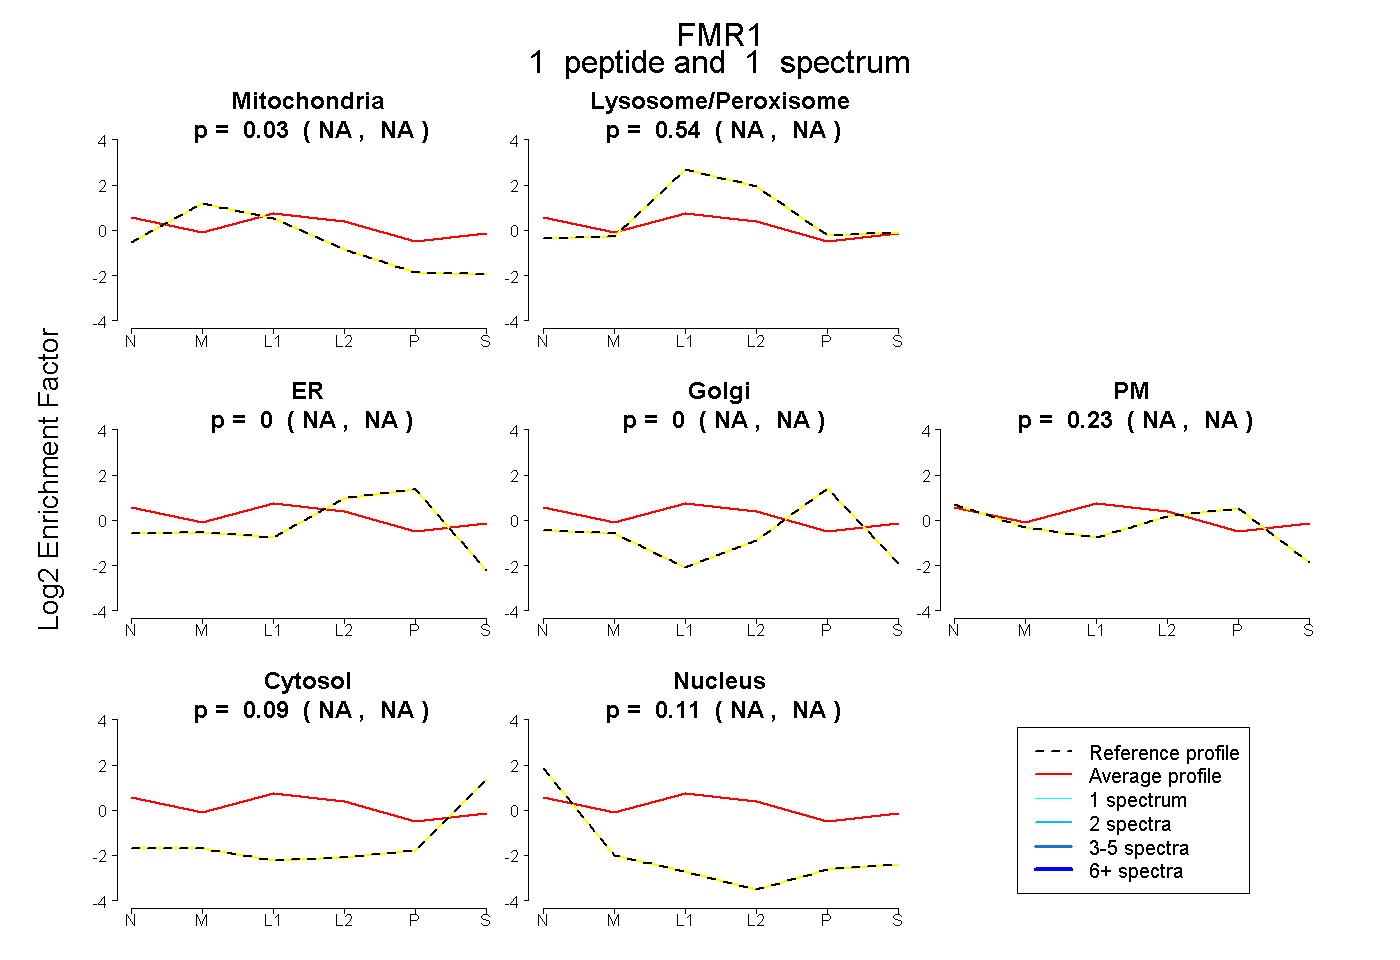 |
0.033 NA | NA |
0.540 NA | NA |
0.000 NA | NA |
0.000 NA | NA |
0.227 NA | NA |
0.093 NA | NA |
0.107 NA | NA |
|||
| Plot | Lyso | Other | |||||||||||
| Expt C |
4 peptides |
8 spectra |
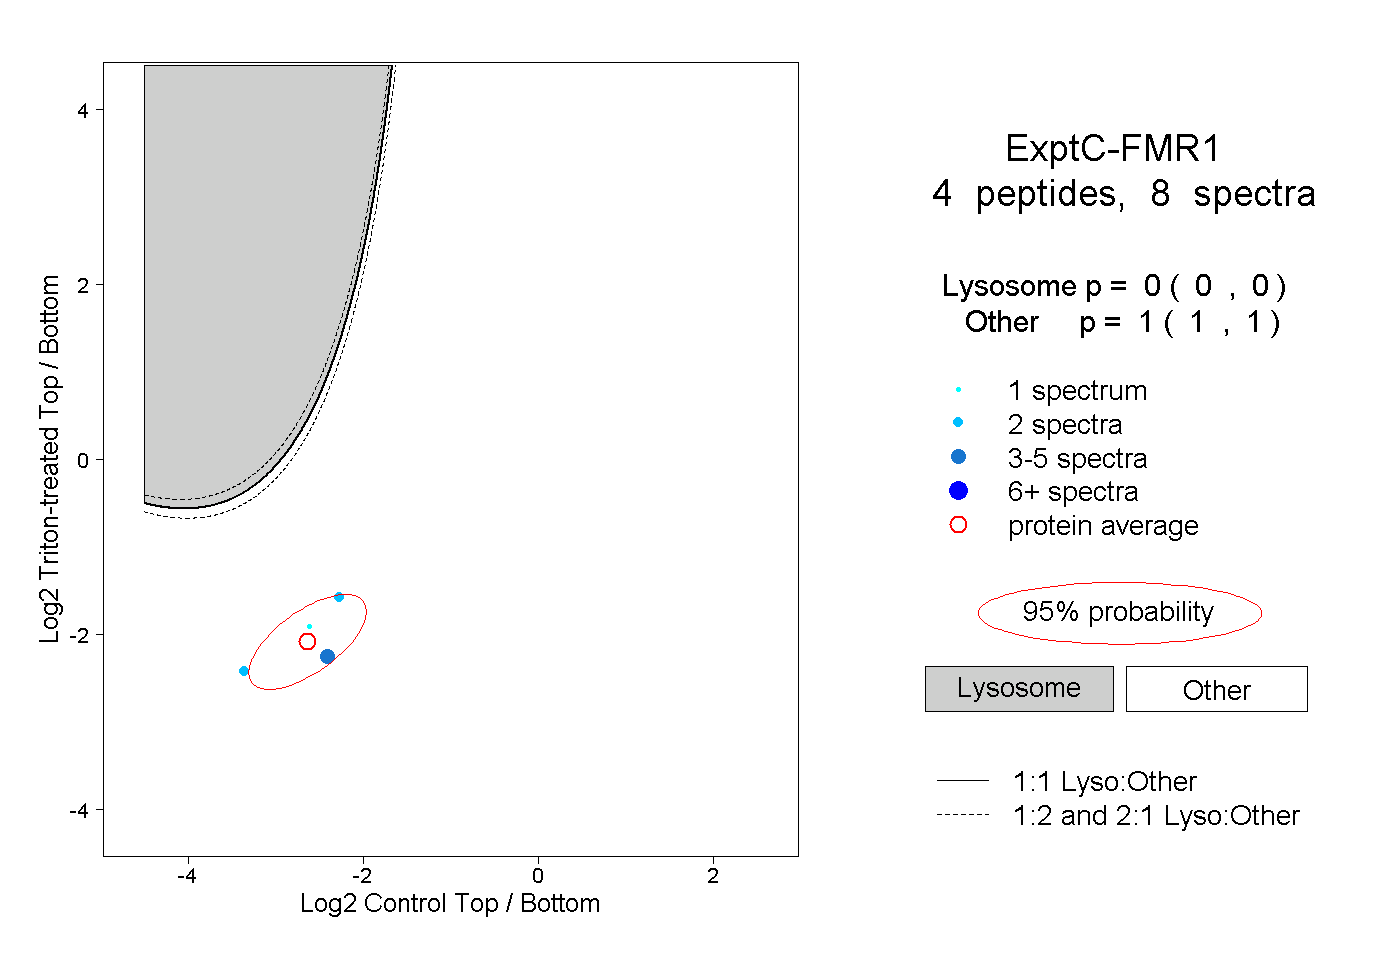 |
0.000 0.000 | 0.000 |
1.000 1.000 | 1.000 |
||||||||
| Plot | Lyso | Other | |||||||||||
| Expt D |
1 peptide |
1 spectrum |
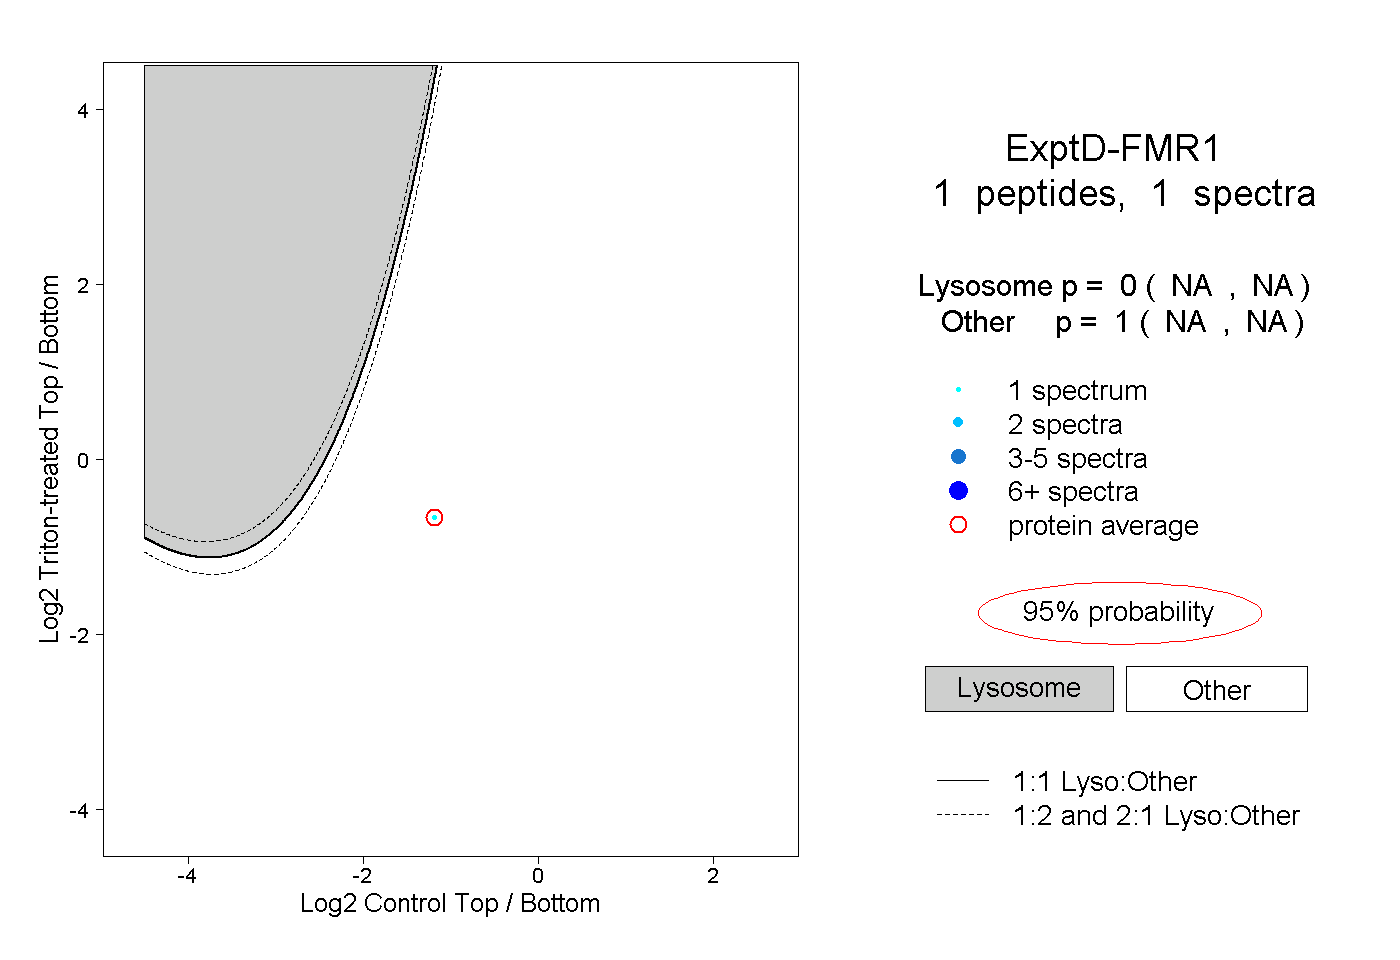 |
0.000 NA | NA |
1.000 NA | NA |