 22
22peptides
spectra
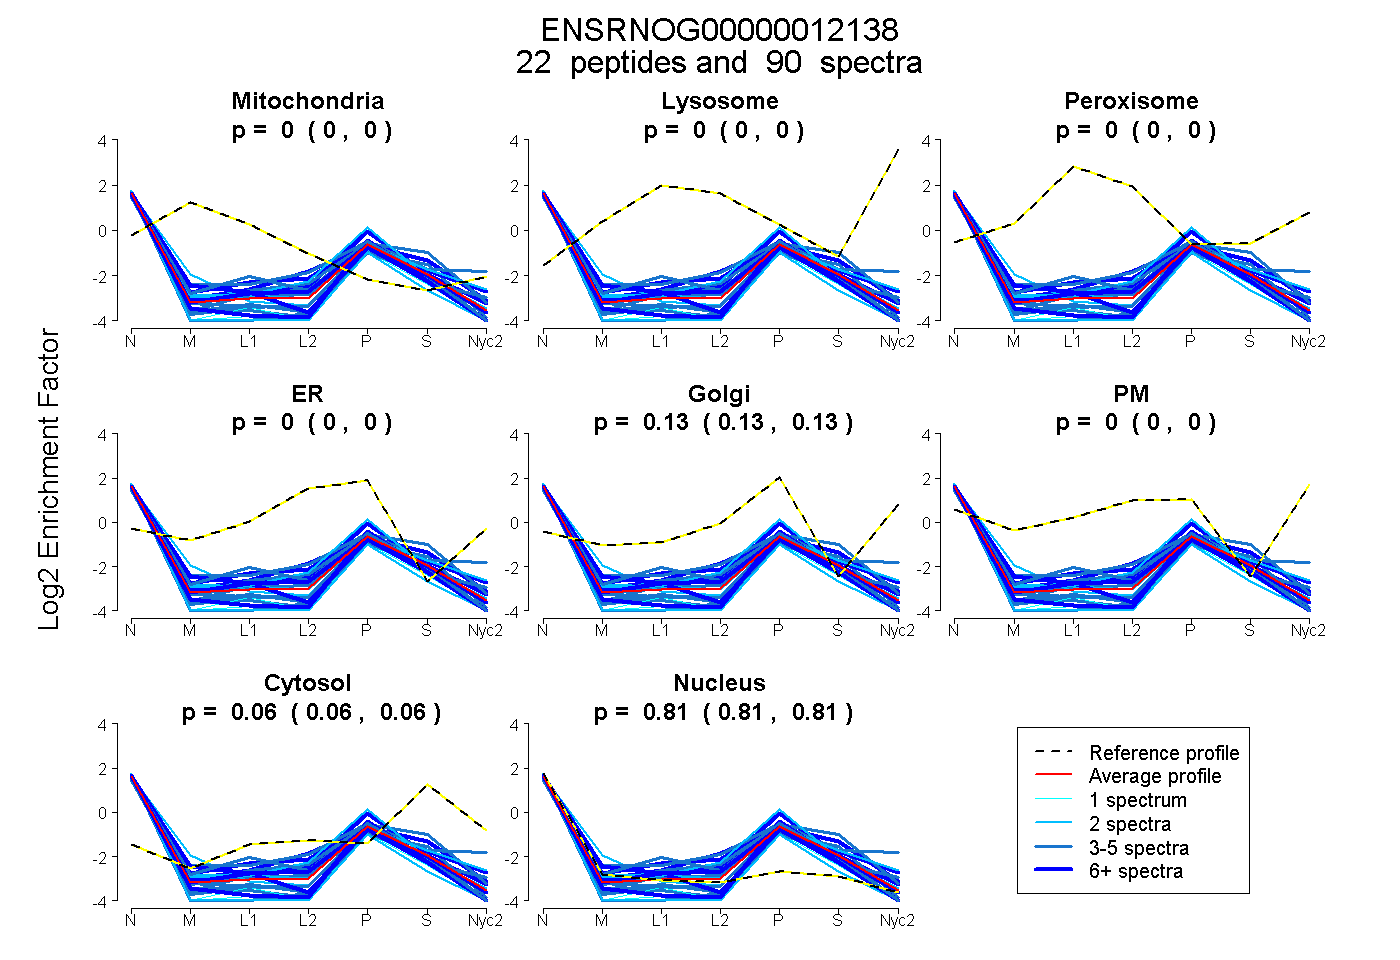
0.000 | 0.000
0.000 | 0.000
0.000 | 0.000
0.000 | 0.000
0.126 | 0.132
0.000 | 0.000
0.059 | 0.065
0.805 | 0.811
| Plot | Mito | Lyso | Perox | ER | Golgi | PM | Cytosol | Nucleus | |||||
| Expt A |
22 peptides |
90 spectra |
|
0.000 0.000 | 0.000 |
0.000 0.000 | 0.000 |
0.000 0.000 | 0.000 |
0.000 0.000 | 0.000 |
0.129 0.126 | 0.132 |
0.000 0.000 | 0.000 |
0.062 0.059 | 0.065 |
0.808 0.805 | 0.811 |
| 2 spectra, SAPPTR | 0.000 | 0.000 | 0.000 | 0.000 | 0.183 | 0.000 | 0.108 | 0.709 | ||
| 6 spectra, SDLYSSGR | 0.000 | 0.000 | 0.000 | 0.000 | 0.121 | 0.000 | 0.000 | 0.879 | ||
| 2 spectra, SSSGMGGR | 0.000 | 0.000 | 0.000 | 0.086 | 0.190 | 0.000 | 0.000 | 0.724 | ||
| 3 spectra, IVEILLMK | 0.000 | 0.000 | 0.000 | 0.000 | 0.086 | 0.000 | 0.034 | 0.880 | ||
| 3 spectra, EPLPSR | 0.000 | 0.000 | 0.000 | 0.051 | 0.045 | 0.000 | 0.262 | 0.642 | ||
| 3 spectra, GYPPPR | 0.000 | 0.000 | 0.000 | 0.000 | 0.308 | 0.021 | 0.110 | 0.562 | ||
| 1 spectrum, GFAFVTFESPADAK | 0.000 | 0.000 | 0.000 | 0.000 | 0.028 | 0.000 | 0.003 | 0.969 | ||
| 4 spectra, DYAPPPR | 0.000 | 0.000 | 0.000 | 0.096 | 0.000 | 0.000 | 0.067 | 0.837 | ||
| 4 spectra, DSYSSSR | 0.000 | 0.000 | 0.000 | 0.000 | 0.193 | 0.000 | 0.012 | 0.796 | ||
| 6 spectra, YDDYSSSR | 0.000 | 0.000 | 0.000 | 0.049 | 0.090 | 0.000 | 0.067 | 0.793 | ||
| 5 spectra, DDGYSTK | 0.000 | 0.000 | 0.000 | 0.000 | 0.044 | 0.000 | 0.009 | 0.947 | ||
| 4 spectra, DSYESYGNSR | 0.000 | 0.000 | 0.000 | 0.000 | 0.000 | 0.000 | 0.148 | 0.852 | ||
| 4 spectra, GPPPSYGGSSR | 0.000 | 0.000 | 0.000 | 0.000 | 0.000 | 0.000 | 0.053 | 0.947 | ||
| 8 spectra, SGGPPPK | 0.000 | 0.000 | 0.000 | 0.000 | 0.071 | 0.000 | 0.000 | 0.929 | ||
| 2 spectra, LFIGGLNTETNEK | 0.000 | 0.000 | 0.000 | 0.000 | 0.000 | 0.000 | 0.000 | 1.000 | ||
| 1 spectrum, DYPSSR | 0.000 | 0.000 | 0.000 | 0.000 | 0.004 | 0.000 | 0.000 | 0.996 | ||
| 3 spectra, STPSGPVR | 0.000 | 0.000 | 0.000 | 0.189 | 0.000 | 0.000 | 0.033 | 0.778 | ||
| 11 spectra, DSYGGPPR | 0.000 | 0.000 | 0.000 | 0.089 | 0.164 | 0.000 | 0.103 | 0.644 | ||
| 4 spectra, DVYLSPR | 0.000 | 0.000 | 0.000 | 0.000 | 0.095 | 0.000 | 0.033 | 0.872 | ||
| 6 spectra, DDYPSR | 0.000 | 0.000 | 0.000 | 0.156 | 0.000 | 0.000 | 0.199 | 0.645 | ||
| 2 spectra, GPLPVK | 0.000 | 0.000 | 0.000 | 0.000 | 0.130 | 0.000 | 0.000 | 0.870 | ||
| 6 spectra, ALEAVFGK | 0.000 | 0.000 | 0.000 | 0.003 | 0.245 | 0.000 | 0.043 | 0.709 |
| Plot | Lyso | Other | |||||||||||
| Expt C |
1 peptide |
1 spectrum |
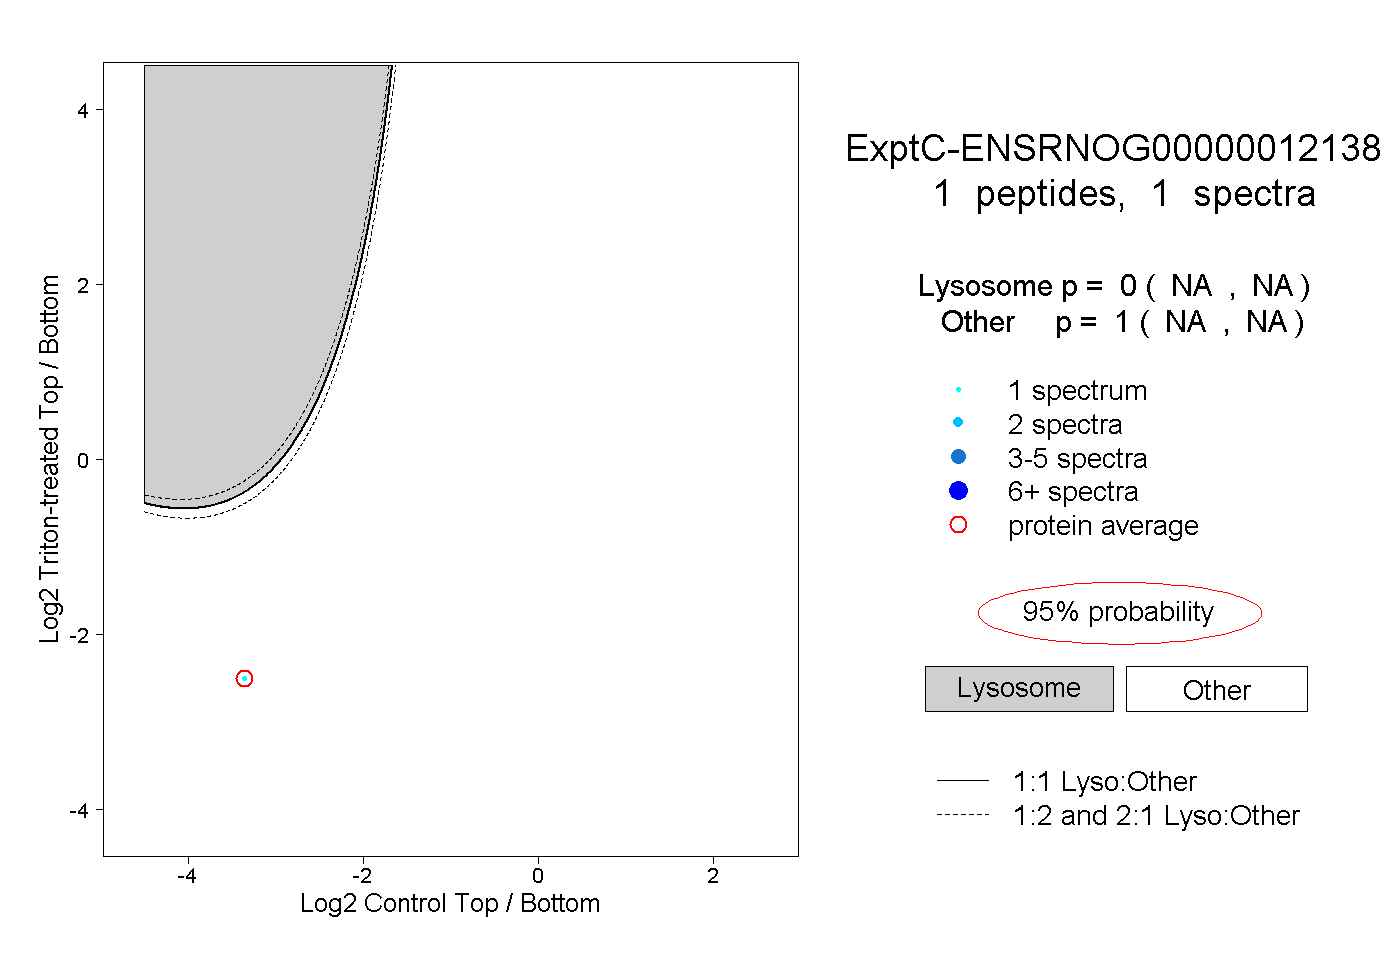 |
0.000 NA | NA |
1.000 NA | NA |