 10
10peptides
spectra
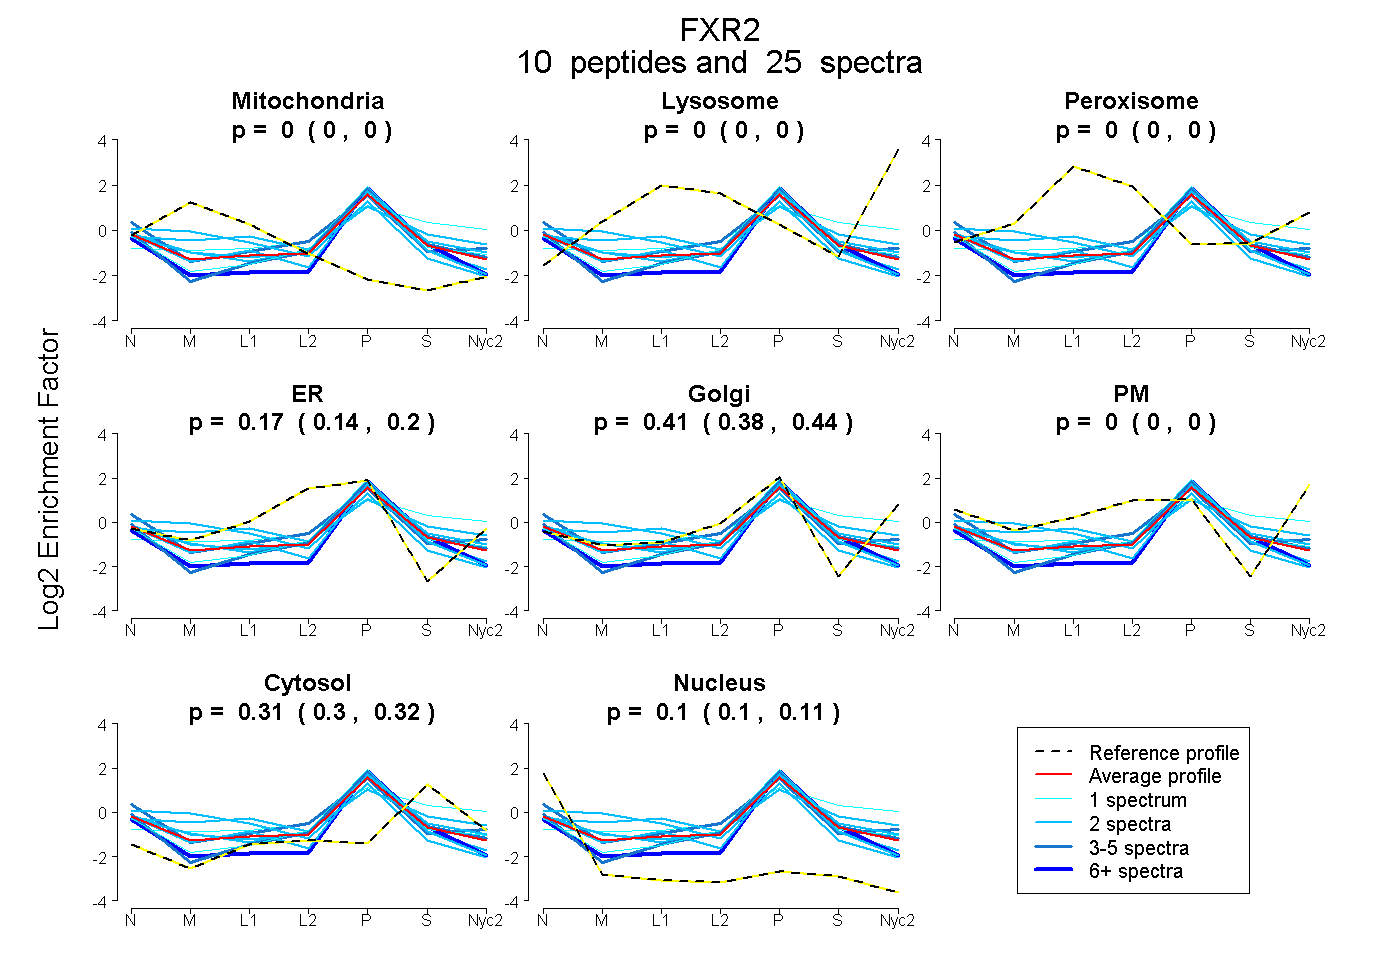
0.000 | 0.000
0.000 | 0.000
0.000 | 0.000
0.141 | 0.196
0.379 | 0.442
0.000 | 0.000
0.303 | 0.319
0.096 | 0.112
4peptides
spectra
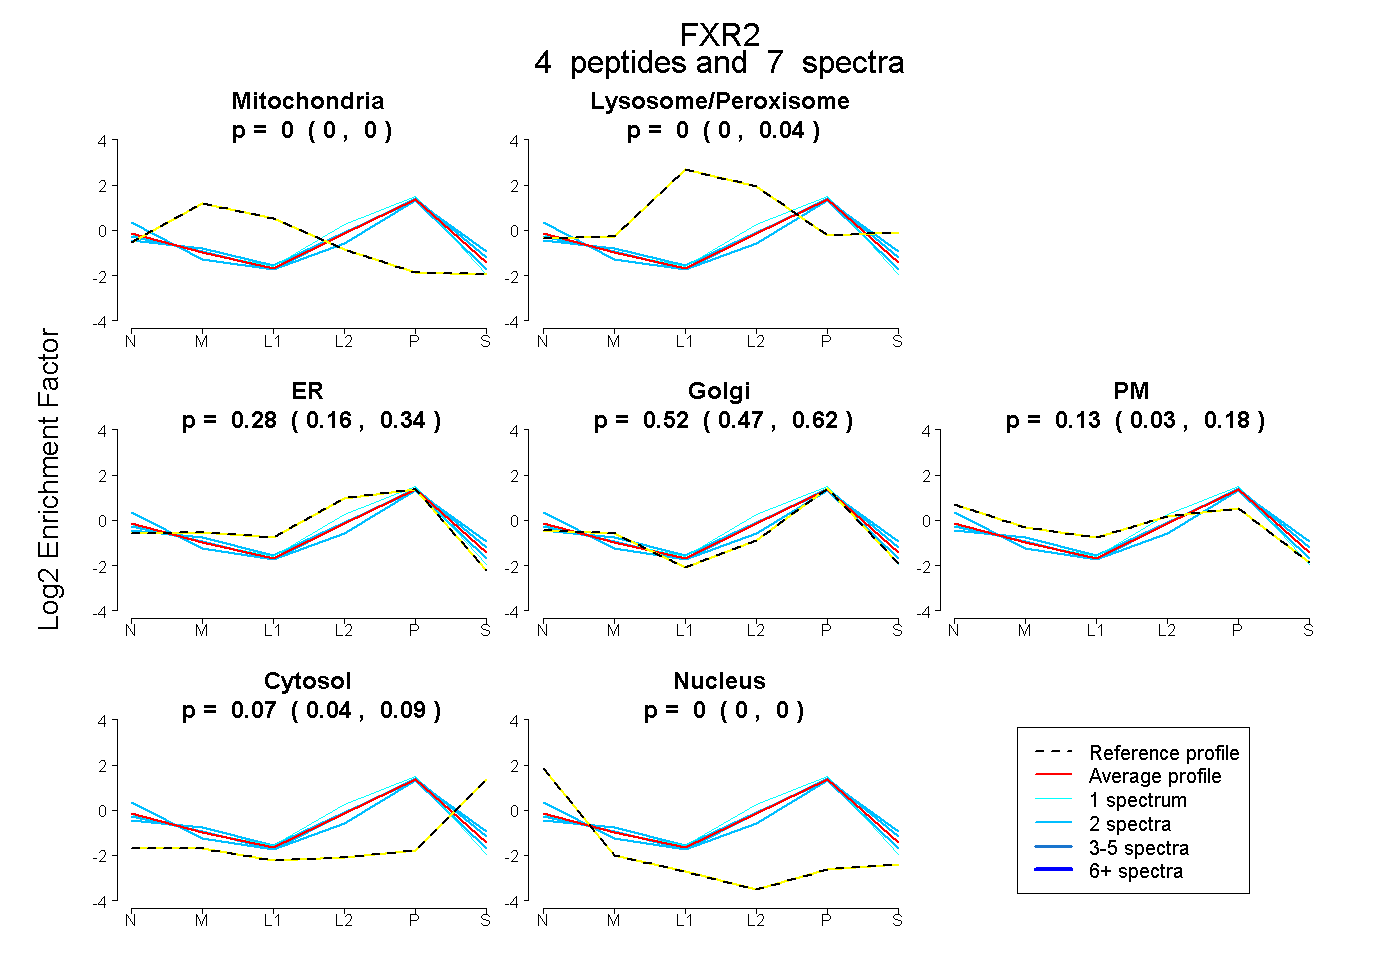
0.000 | 0.000
0.000 | 0.038
0.163 | 0.338
0.474 | 0.623
0.035 | 0.179
0.043 | 0.086
0.000 | 0.000
3peptides
spectra
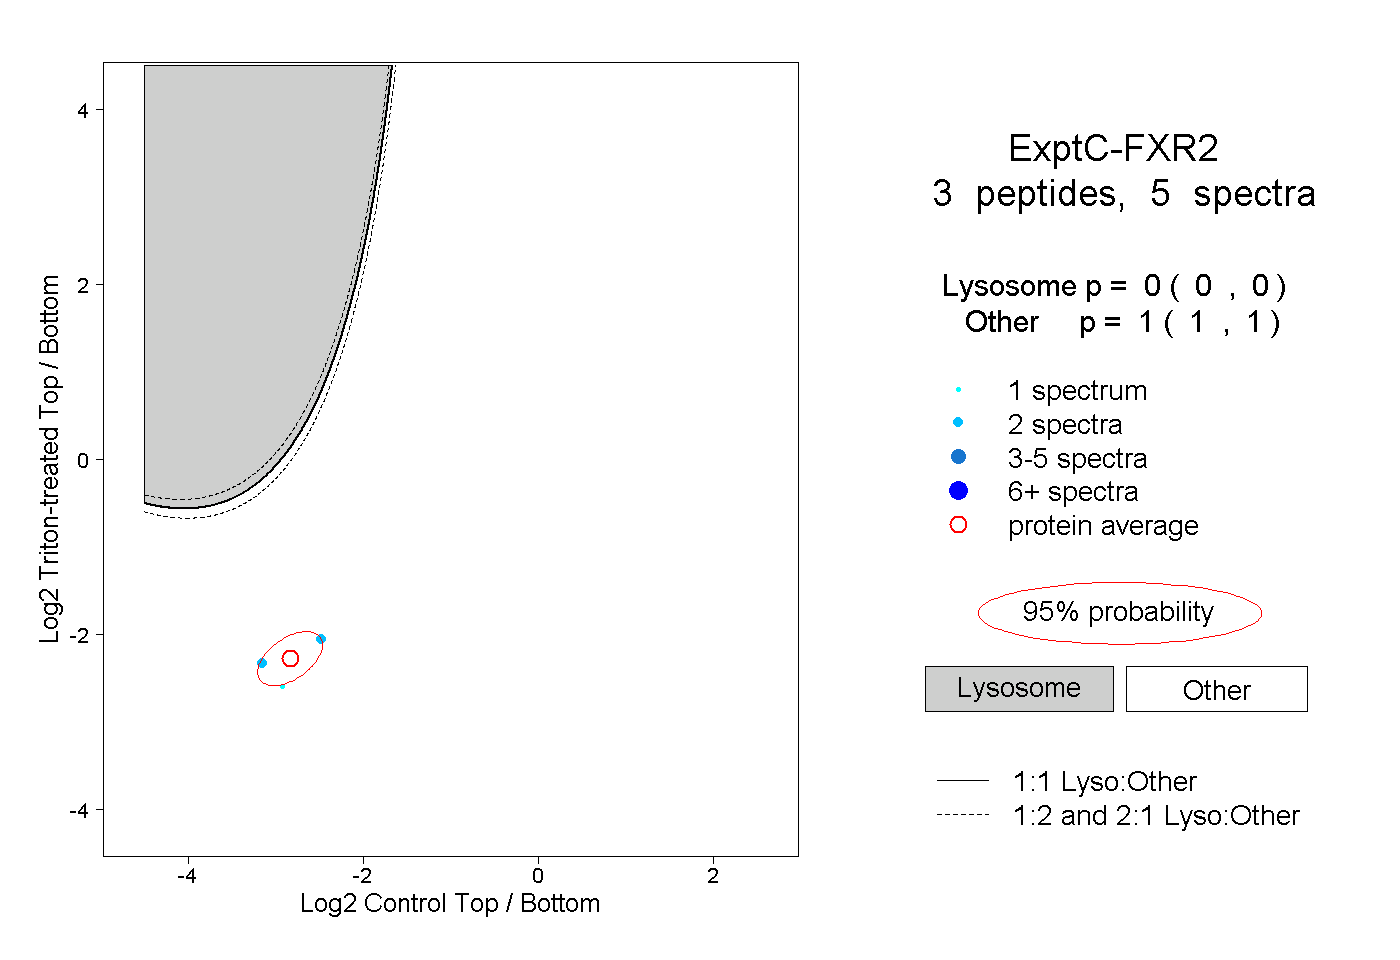
0.000 | 0.000
1.000 | 1.000
1peptide
spectra
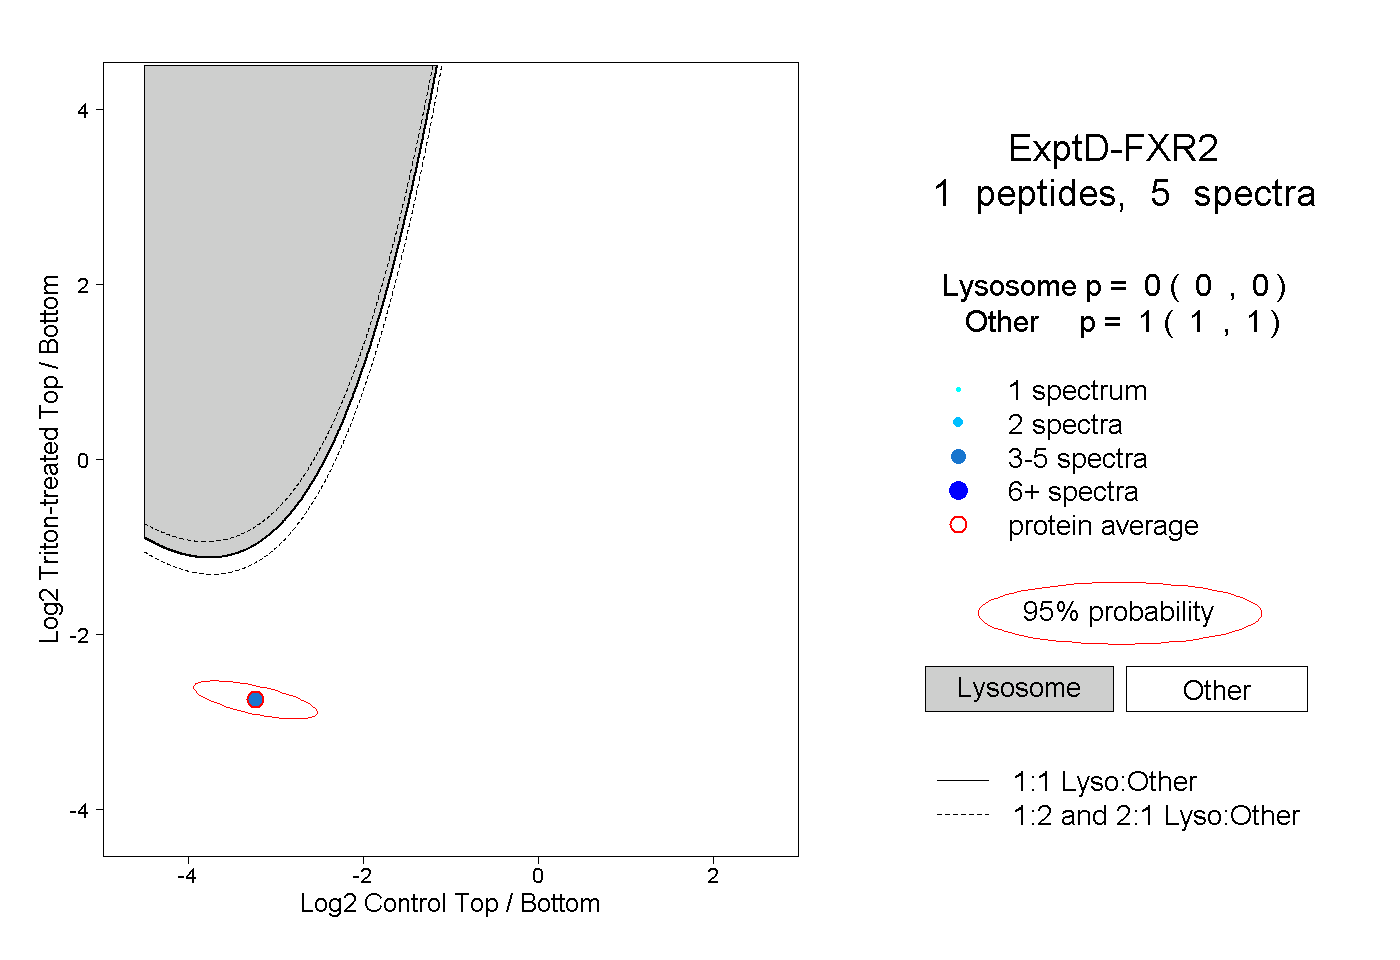
0.000 | 0.000
1.000 | 1.000