 12
12peptides
spectra
0.000 | 0.000
0.000 | 0.000
0.000 | 0.000
0.822 | 0.869
0.081 | 0.125
0.000 | 0.000
0.000 | 0.000
0.042 | 0.051
| Plot | Mito | Lyso | Perox | ER | Golgi | PM | Cytosol | Nucleus | |||||
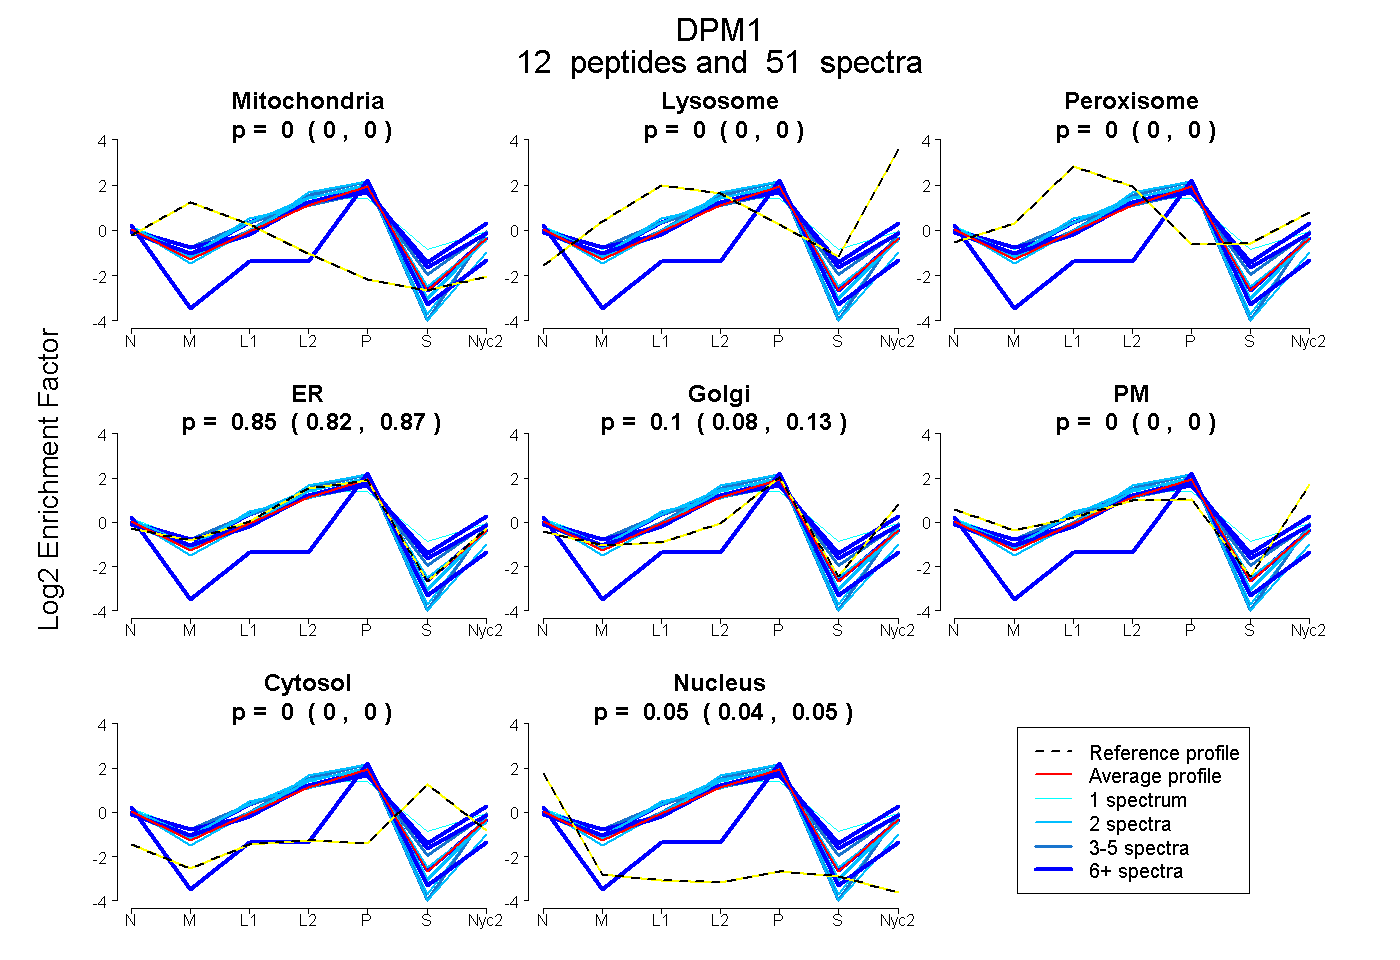
| Expt A |
12 peptides |
51 spectra |
|
0.000 0.000 | 0.000 |
0.000 0.000 | 0.000 |
0.000 0.000 | 0.000 |
0.849 0.822 | 0.869 |
0.104 0.081 | 0.125 |
0.000 0.000 | 0.000 |
0.000 0.000 | 0.000 |
0.047 0.042 | 0.051 |
| 1 spectrum, GNGGVYGWDLK | 0.000 | 0.000 | 0.108 | 0.582 | 0.000 | 0.127 | 0.183 | 0.000 | ||
| 2 spectra, EGNFDIVSGTR | 0.000 | 0.000 | 0.000 | 0.984 | 0.014 | 0.000 | 0.000 | 0.002 | ||
| 10 spectra, SLAASQRPPQGR | 0.000 | 0.000 | 0.000 | 0.000 | 0.690 | 0.000 | 0.000 | 0.310 | ||
| 2 spectra, LGLGTAYIHGIK | 0.000 | 0.000 | 0.000 | 0.975 | 0.000 | 0.000 | 0.000 | 0.025 | ||
| 2 spectra, LGGNEIVSFLK | 0.000 | 0.000 | 0.000 | 0.946 | 0.018 | 0.000 | 0.000 | 0.036 | ||
| 2 spectra, ILLRPR | 0.000 | 0.000 | 0.000 | 0.962 | 0.000 | 0.000 | 0.000 | 0.038 | ||
| 4 spectra, FIPEFIR | 0.000 | 0.000 | 0.000 | 0.978 | 0.022 | 0.000 | 0.000 | 0.000 | ||
| 6 spectra, IYGPDR | 0.000 | 0.029 | 0.009 | 0.591 | 0.011 | 0.227 | 0.133 | 0.000 | ||
| 8 spectra, VYGESK | 0.000 | 0.000 | 0.000 | 0.763 | 0.032 | 0.072 | 0.132 | 0.000 | ||
| 2 spectra, QMDYTVGEVPISFVDR | 0.000 | 0.000 | 0.035 | 0.943 | 0.000 | 0.000 | 0.000 | 0.022 | ||
| 7 spectra, EVAEQLEK | 0.000 | 0.000 | 0.021 | 0.932 | 0.000 | 0.015 | 0.000 | 0.032 | ||
| 5 spectra, GYVFQMEMIVR | 0.000 | 0.000 | 0.138 | 0.660 | 0.161 | 0.000 | 0.035 | 0.006 |
| Plot | Mito | Lyso or Perox | ER | Golgi | PM | Cytosol | Nucleus | ||||||
| Expt B |
5 peptides |
16 spectra |
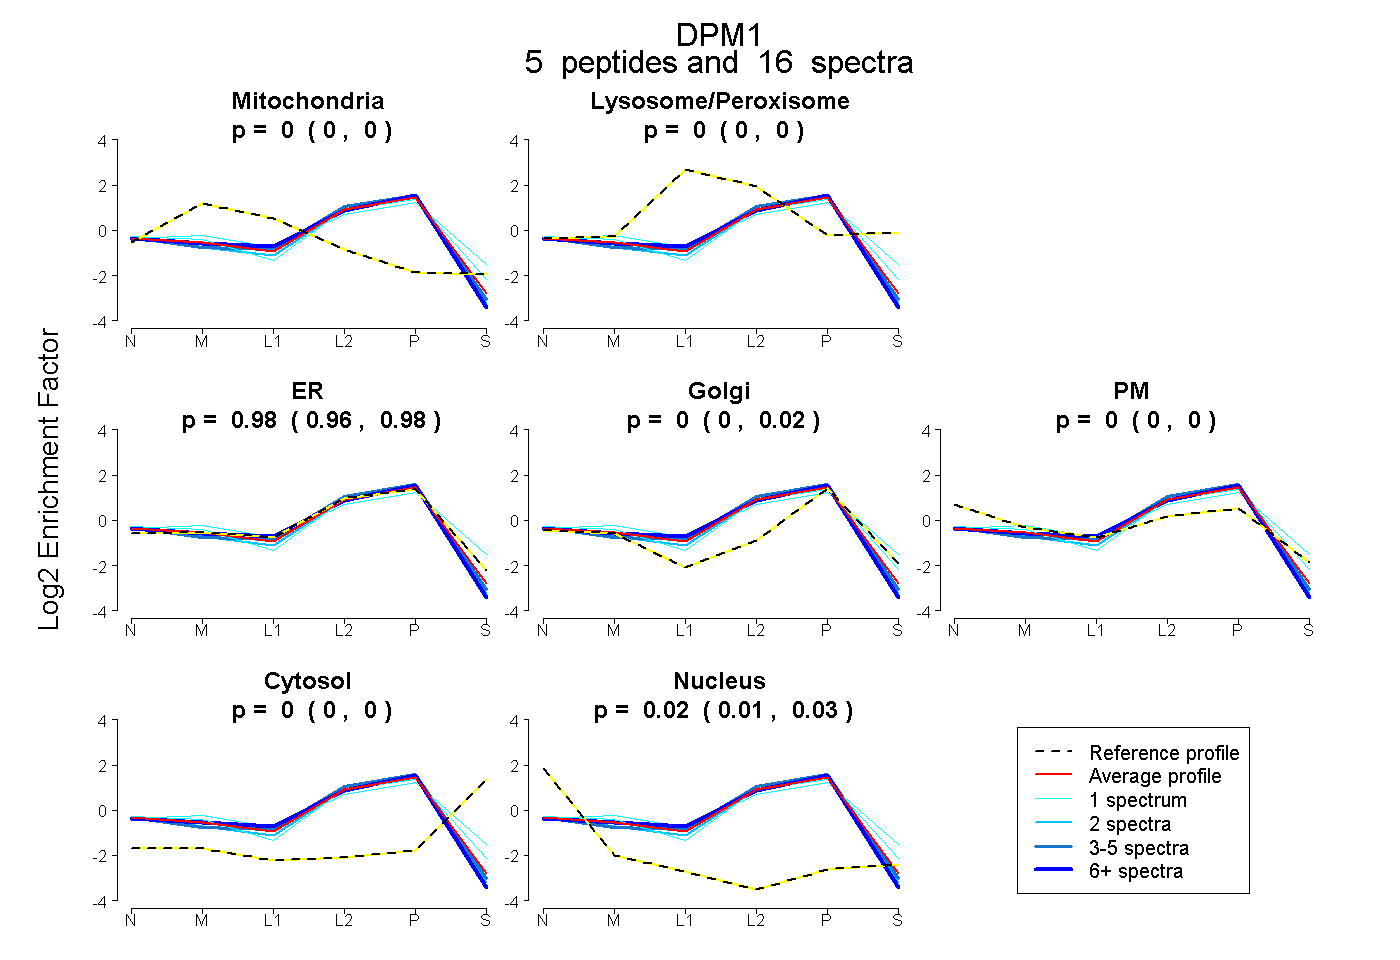 |
0.000 0.000 | 0.000 |
0.000 0.000 | 0.000 |
0.978 0.955 | 0.981 |
0.000 0.000 | 0.024 |
0.000 0.000 | 0.000 |
0.000 0.000 | 0.000 |
0.022 0.014 | 0.026 |
|||
| Plot | Lyso | Other | |||||||||||
| Expt C |
12 peptides |
48 spectra |
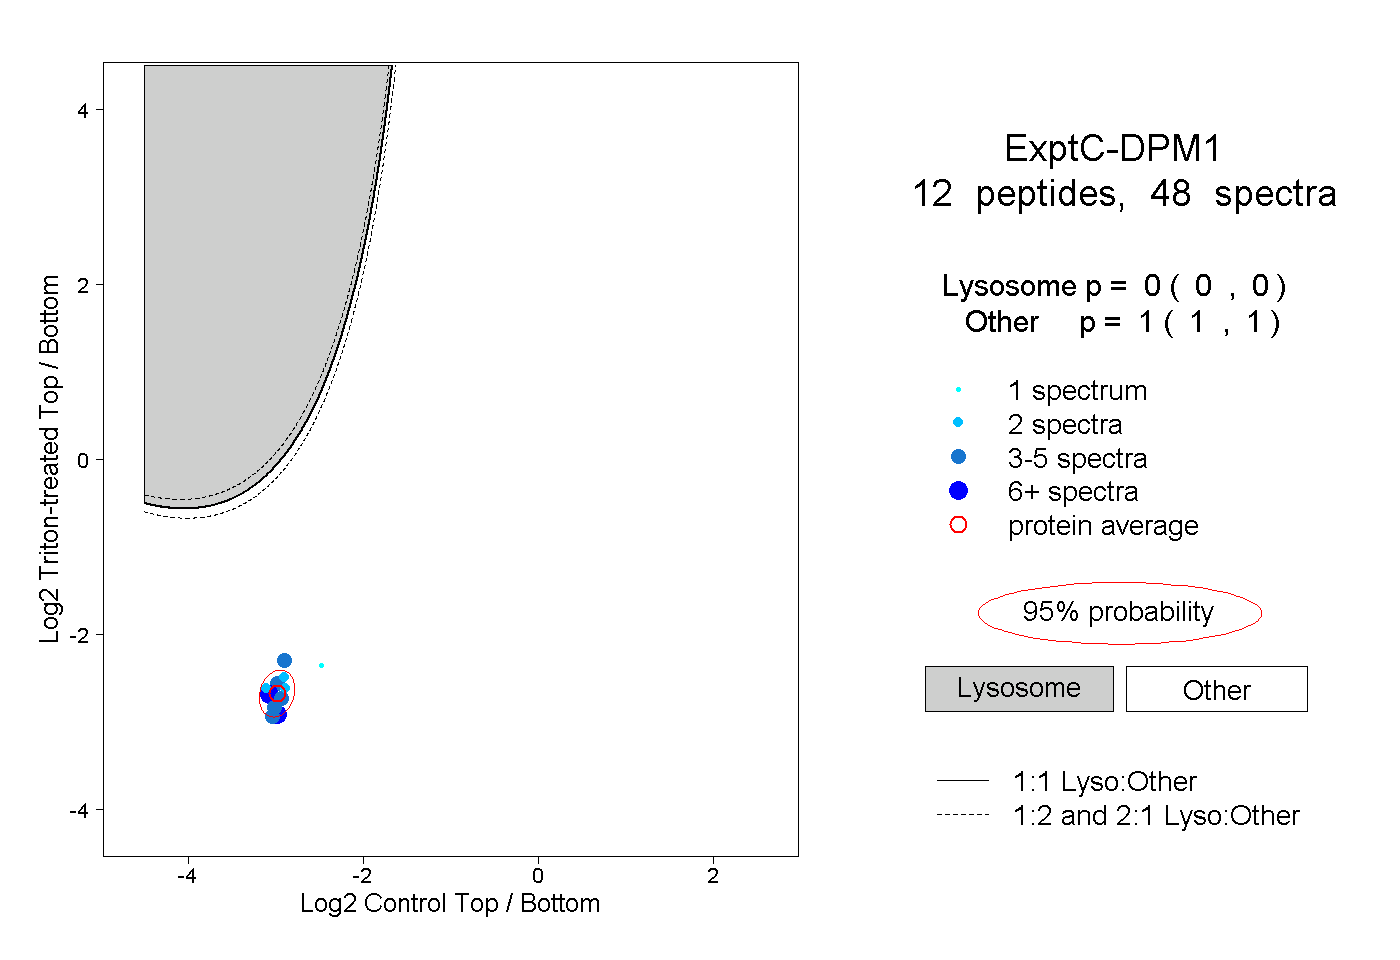 |
0.000 0.000 | 0.000 |
1.000 1.000 | 1.000 |
||||||||
| Plot | Lyso | Other | |||||||||||
| Expt D |
6 peptides |
15 spectra |
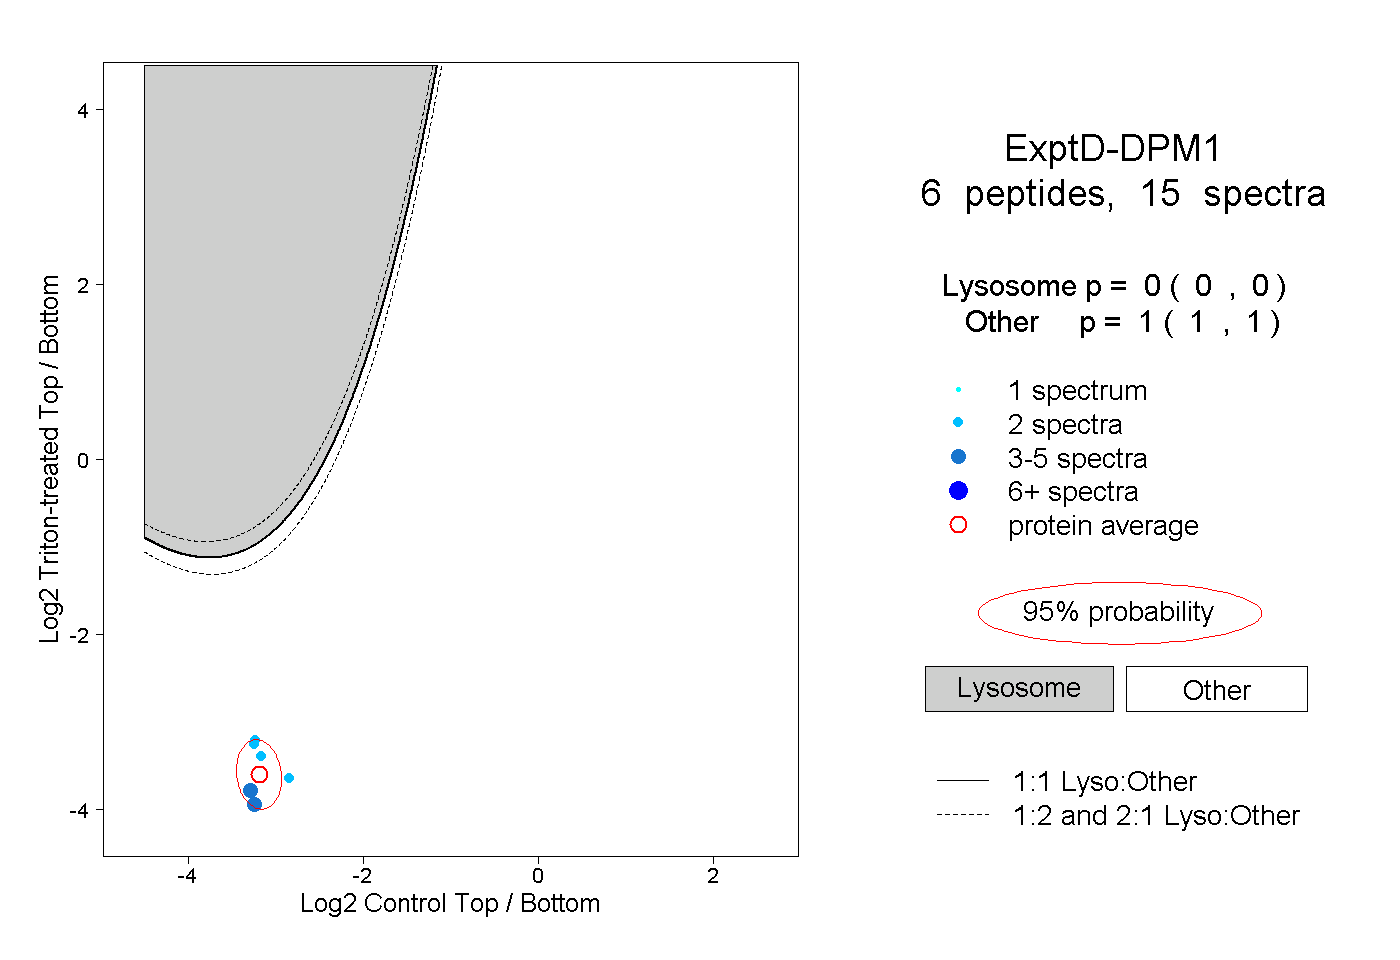 |
0.000 0.000 | 0.000 |
1.000 1.000 | 1.000 |