 30
30peptides
spectra
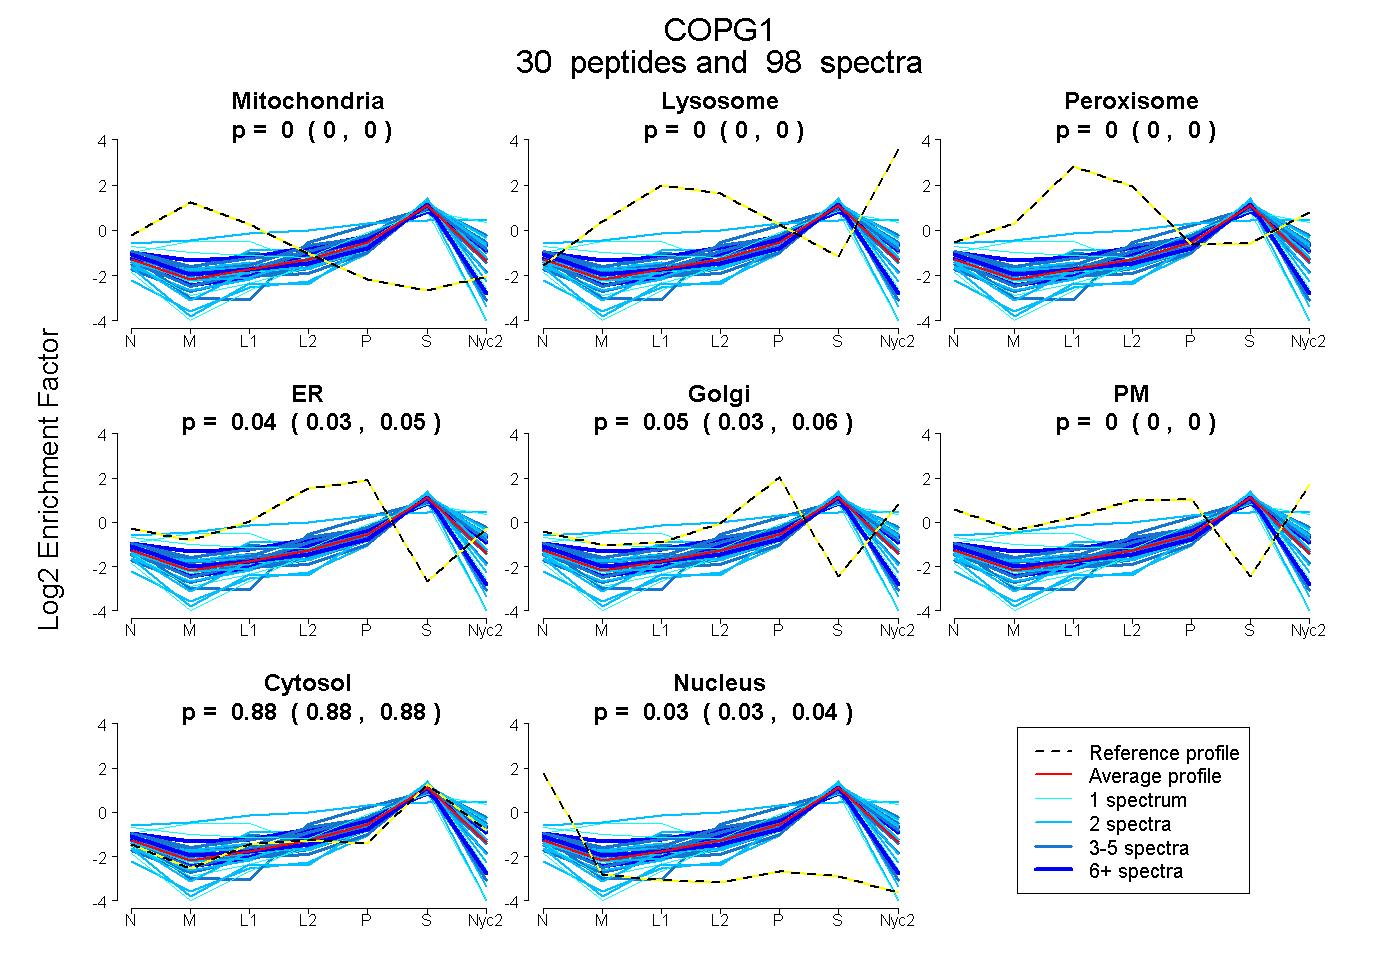
0.000 | 0.000
0.000 | 0.000
0.000 | 0.000
0.027 | 0.049
0.031 | 0.059
0.000 | 0.000
0.879 | 0.883
0.031 | 0.037
14peptides
spectra
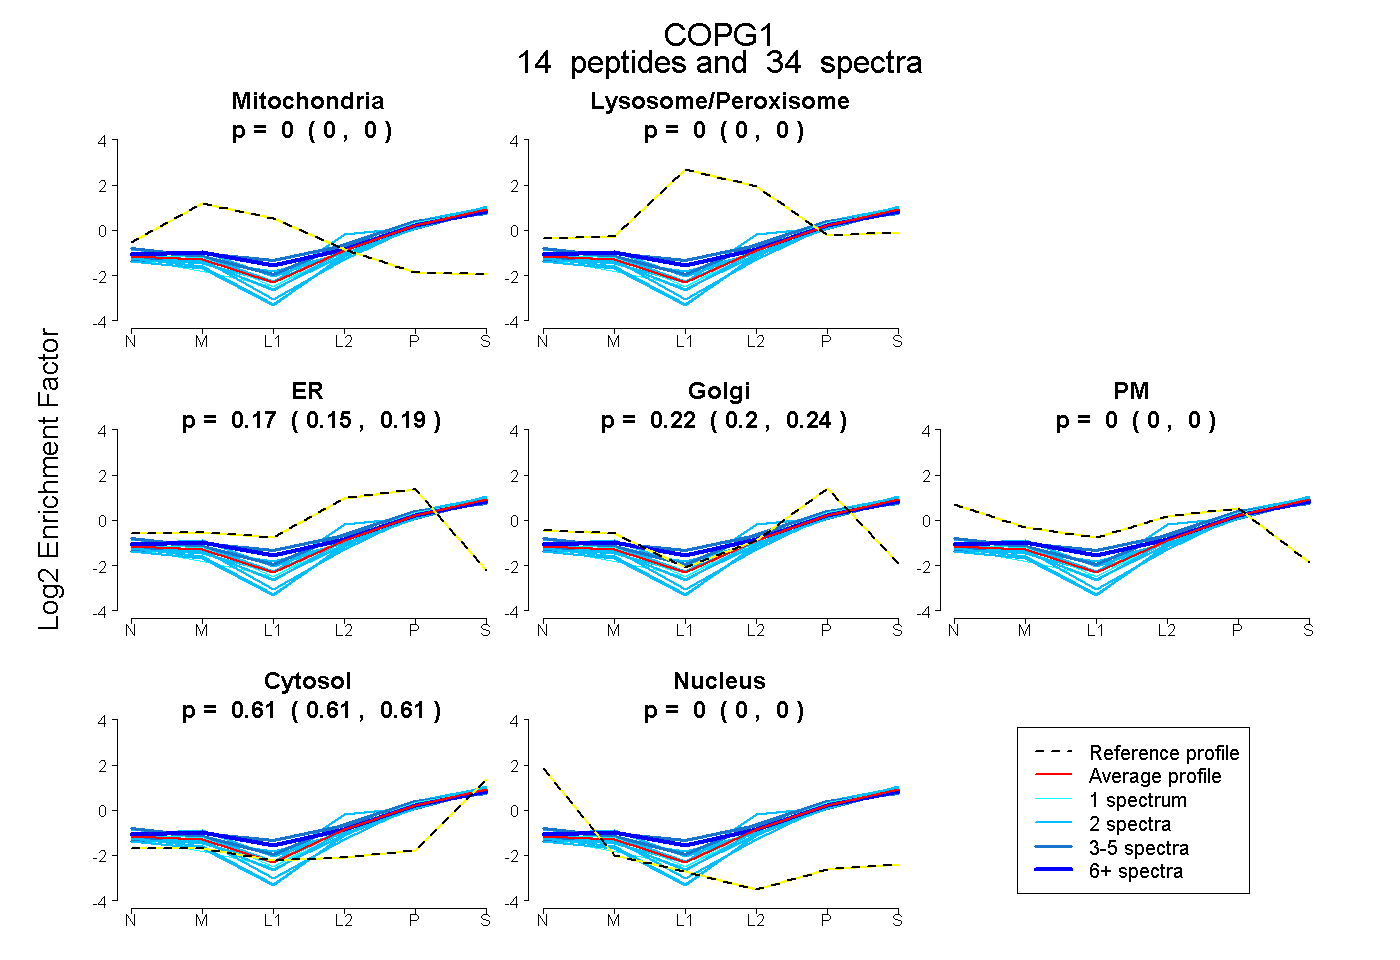
0.000 | 0.000
0.000 | 0.000
0.154 | 0.185
0.201 | 0.236
0.000 | 0.000
0.606 | 0.612
0.000 | 0.000
18peptides
spectra
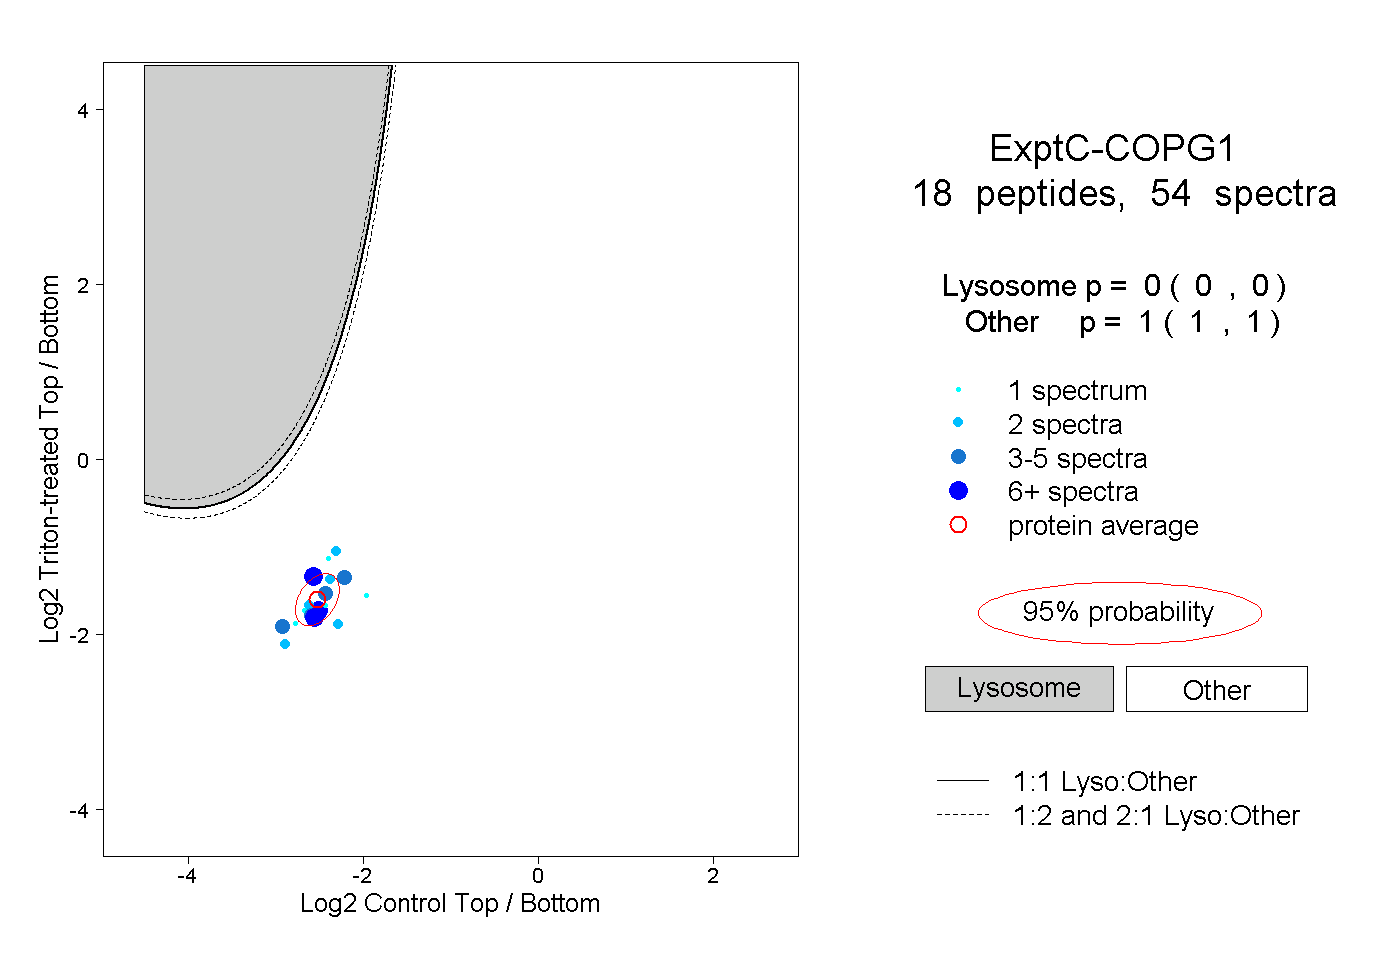
0.000 | 0.000
1.000 | 1.000
4peptides
spectra
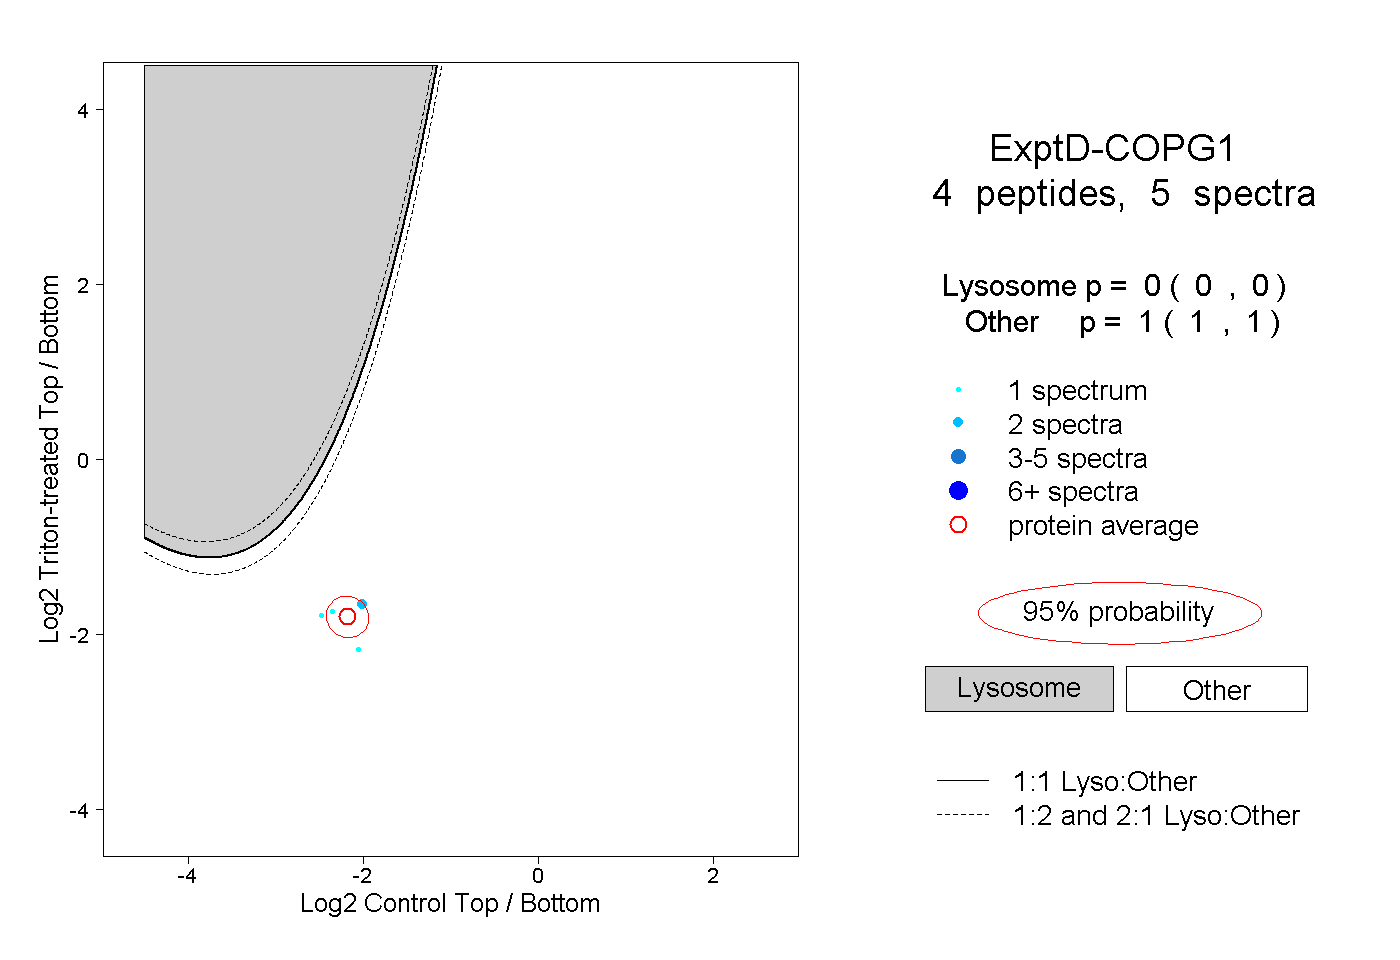
0.000 | 0.000
1.000 | 1.000