 3
3peptides
spectra
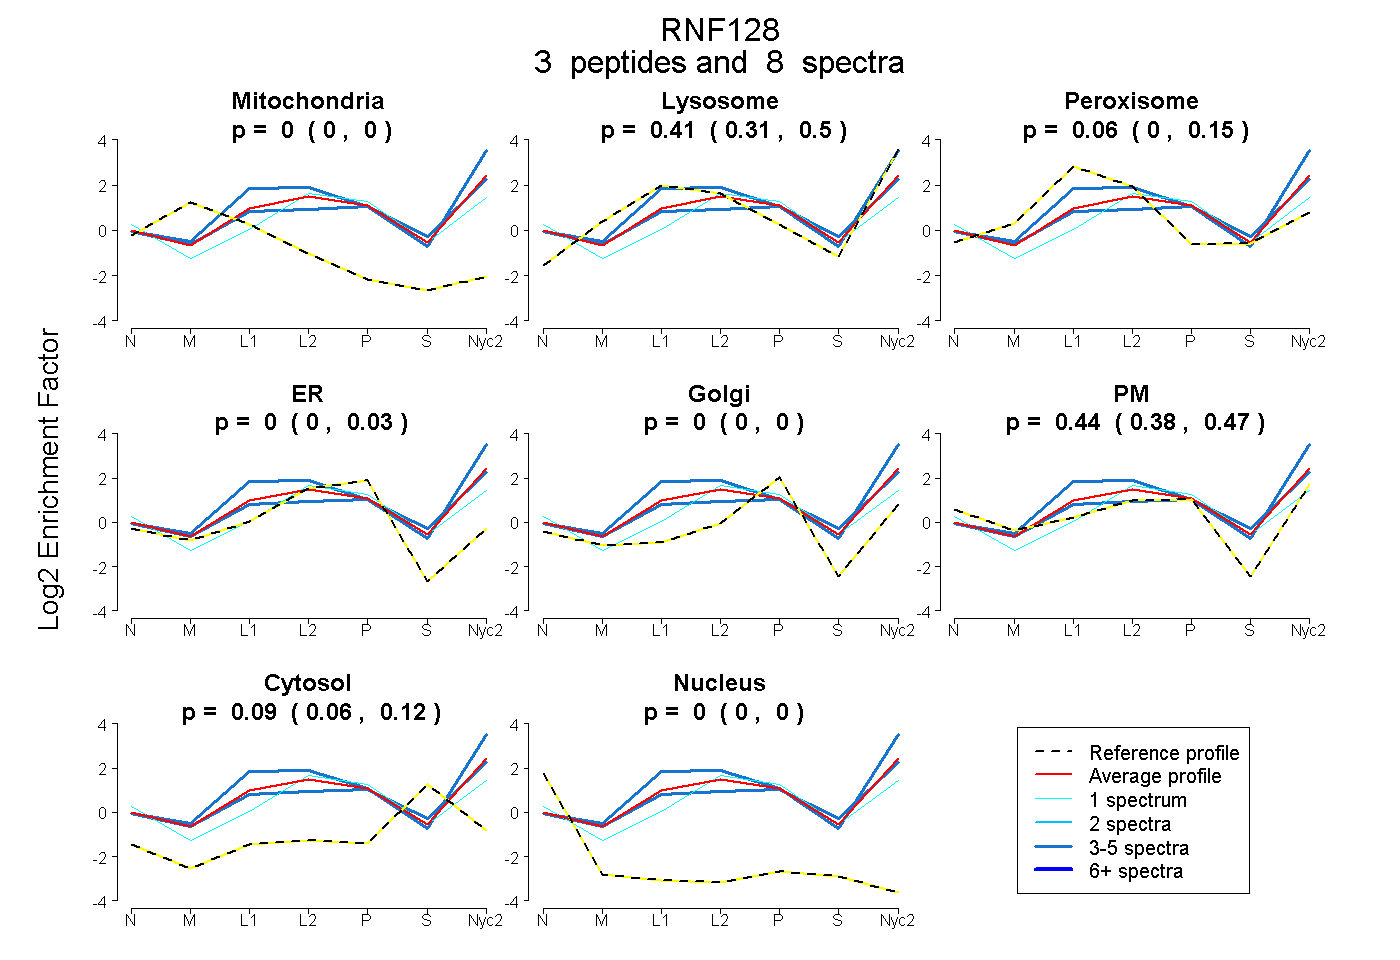
0.000 | 0.000
0.311 | 0.495
0.000 | 0.149
0.000 | 0.030
0.000 | 0.000
0.383 | 0.473
0.060 | 0.122
0.000 | 0.000
| Plot | Mito | Lyso | Perox | ER | Golgi | PM | Cytosol | Nucleus | |||||
| Expt A |
3 peptides |
8 spectra |
|
0.000 0.000 | 0.000 |
0.412 0.311 | 0.495 |
0.055 0.000 | 0.149 |
0.000 0.000 | 0.030 |
0.000 0.000 | 0.000 |
0.439 0.383 | 0.473 |
0.094 0.060 | 0.122 |
0.000 0.000 | 0.000 |
| 1 spectrum, TCVDPWLLEHR | 0.000 | 0.162 | 0.015 | 0.198 | 0.000 | 0.448 | 0.177 | 0.000 | ||
| 4 spectra, IHLAYER | 0.000 | 0.722 | 0.001 | 0.000 | 0.000 | 0.277 | 0.000 | 0.000 | ||
| 3 spectra, GGGCTFADK | 0.000 | 0.417 | 0.004 | 0.000 | 0.000 | 0.406 | 0.173 | 0.000 |
| Plot | Lyso | Other | |||||||||||
| Expt C |
5 peptides |
7 spectra |
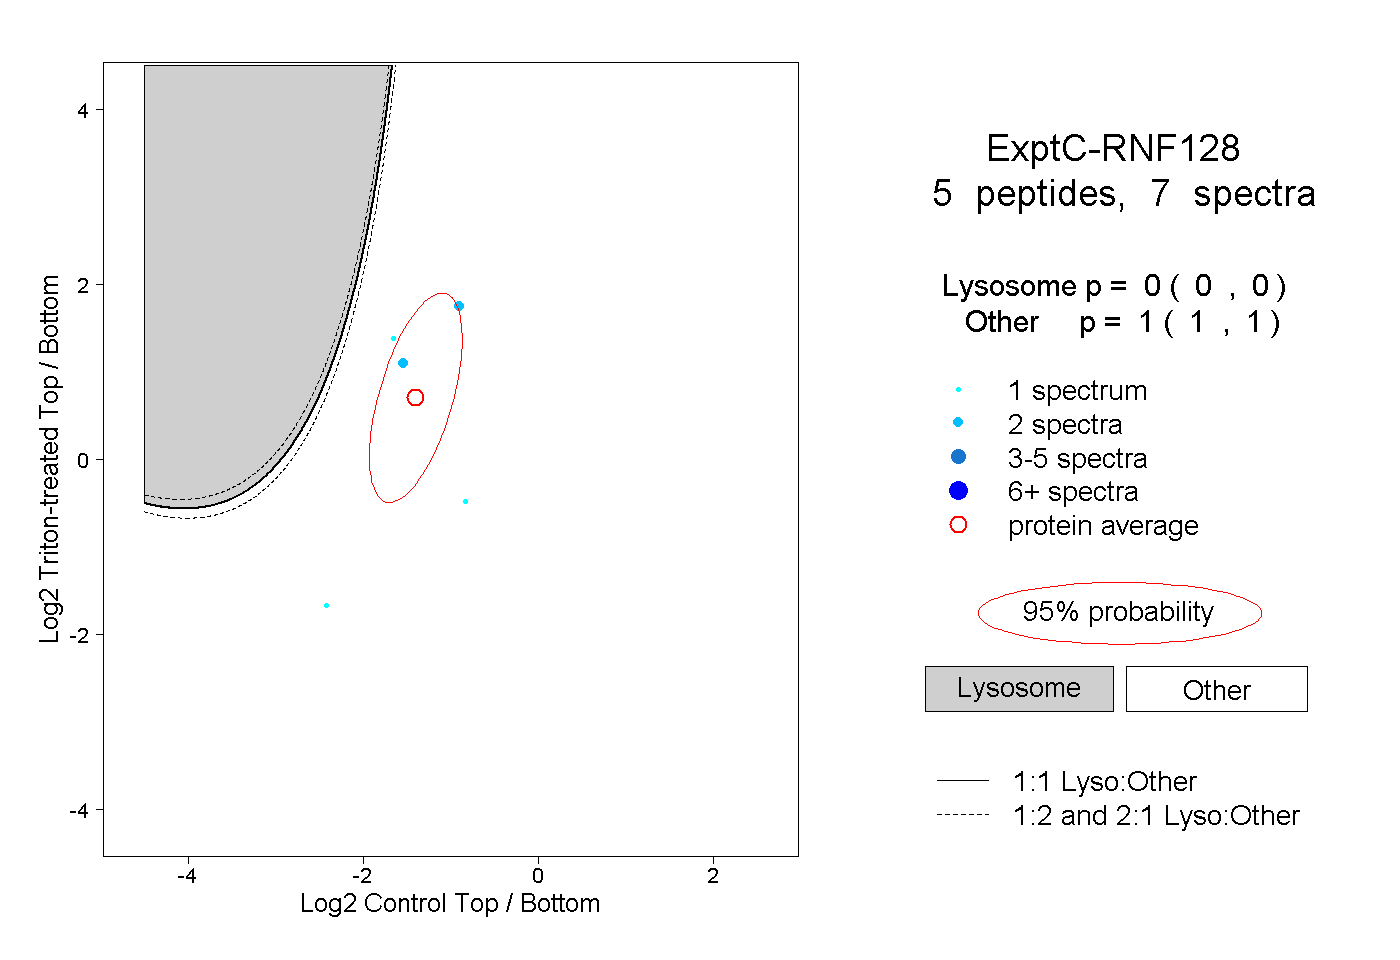 |
0.000 0.000 | 0.000 |
1.000 1.000 | 1.000 |