 4
4peptides
spectra
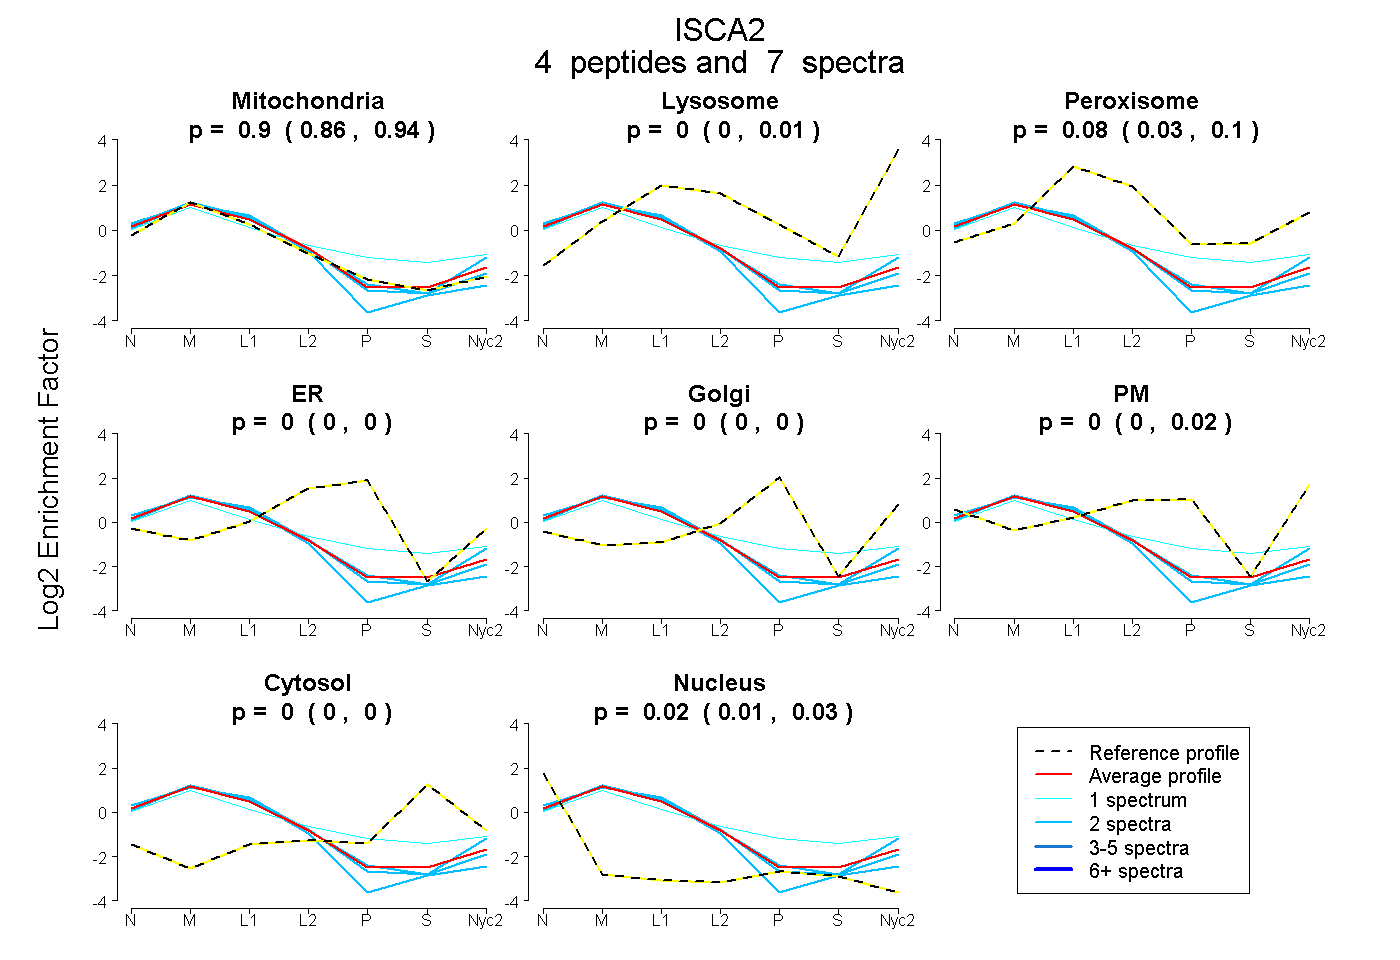
0.856 | 0.938
0.000 | 0.010
0.035 | 0.103
0.000 | 0.000
0.000 | 0.000
0.000 | 0.018
0.000 | 0.000
0.008 | 0.033
2peptides
spectra
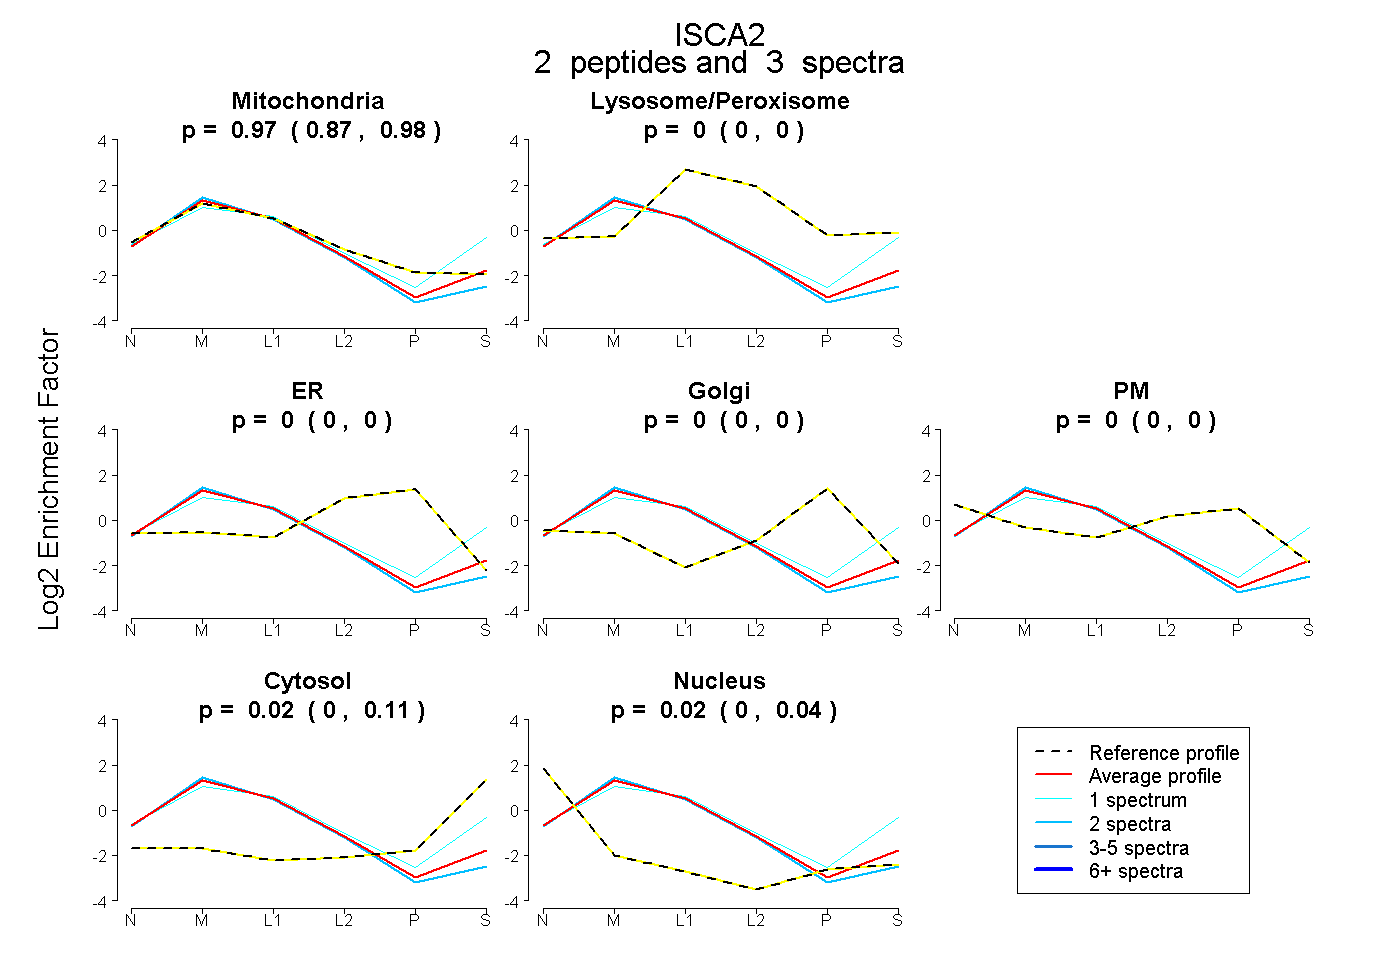
0.873 | 0.984
0.000 | 0.000
0.000 | 0.000
0.000 | 0.000
0.000 | 0.000
0.000 | 0.109
0.000 | 0.041
7peptides
spectra
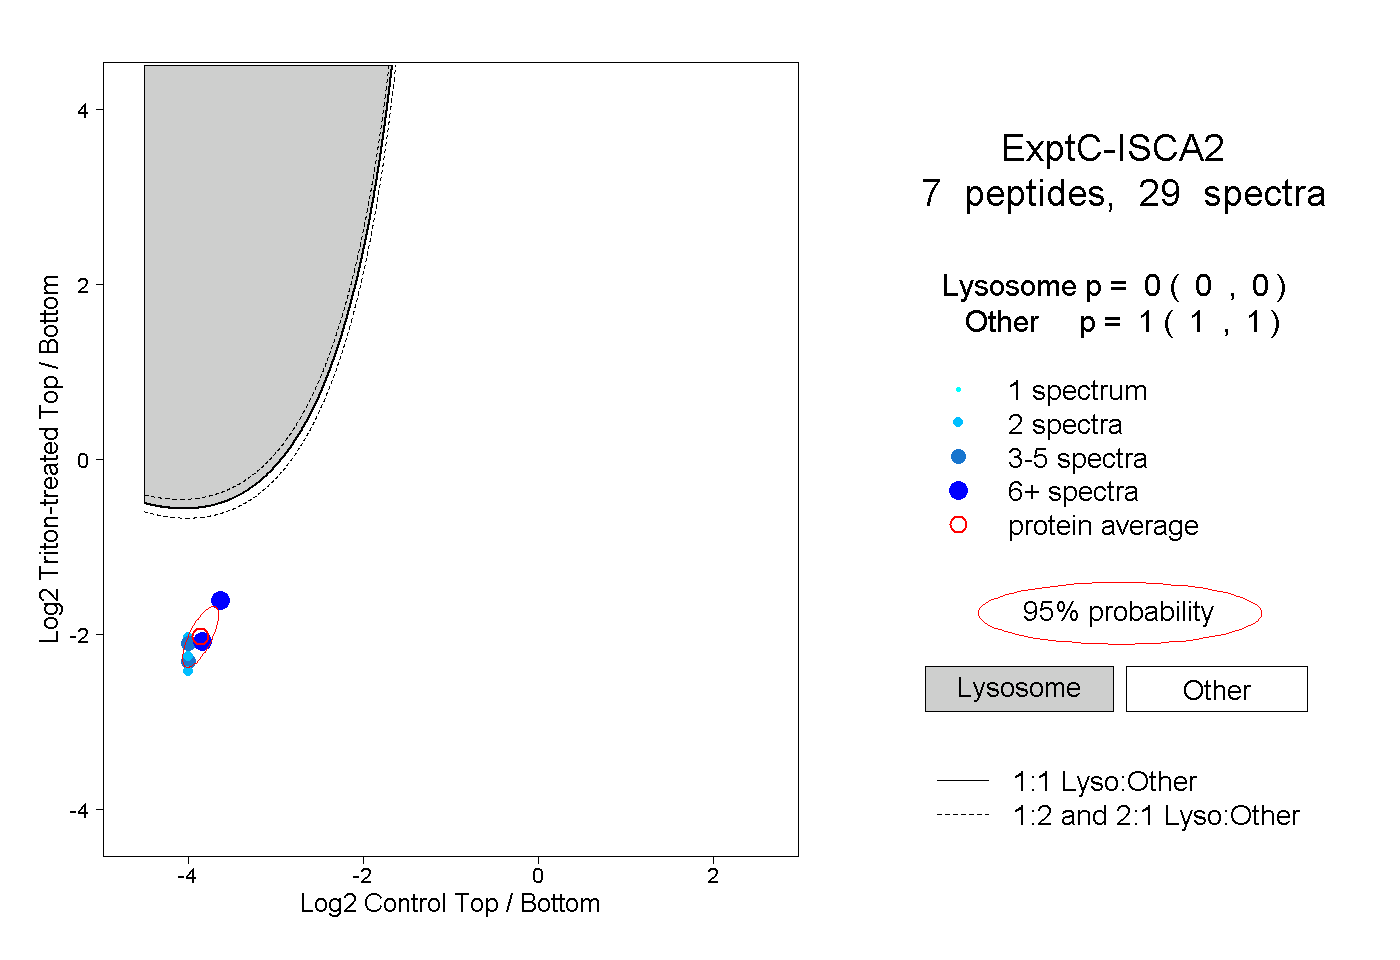
0.000 | 0.000
1.000 | 1.000
1peptide
spectra
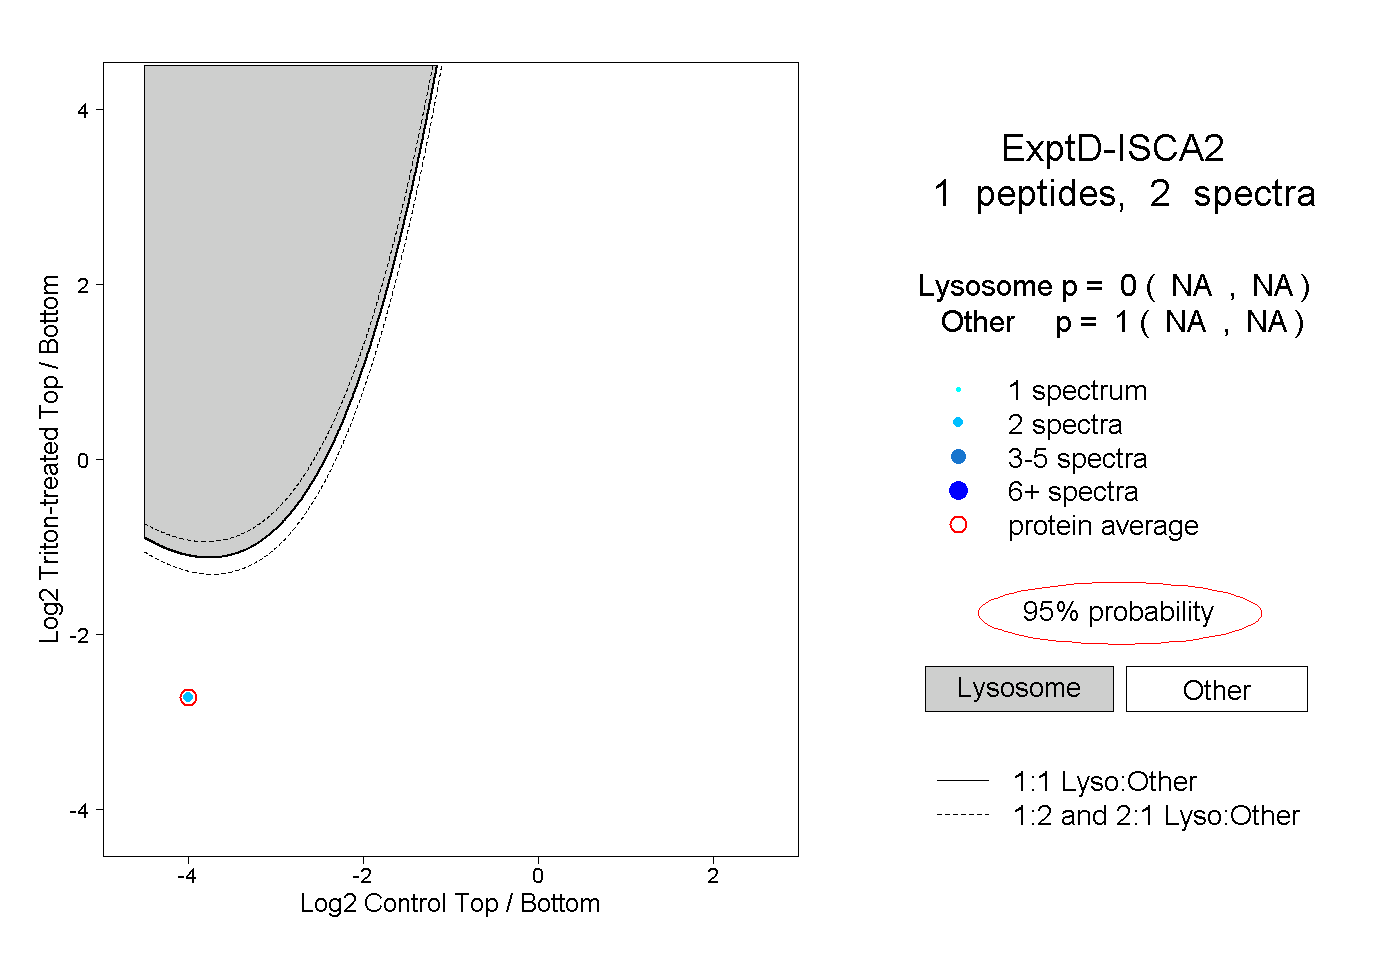
NA | NA
NA | NA