 4
4peptides
spectra
0.000 | 0.041
0.000 | 0.000
0.000 | 0.124
0.112 | 0.418
0.135 | 0.534
0.000 | 0.203
0.092 | 0.289
0.000 | 0.067
1peptide
spectra
NA | NA
NA | NA
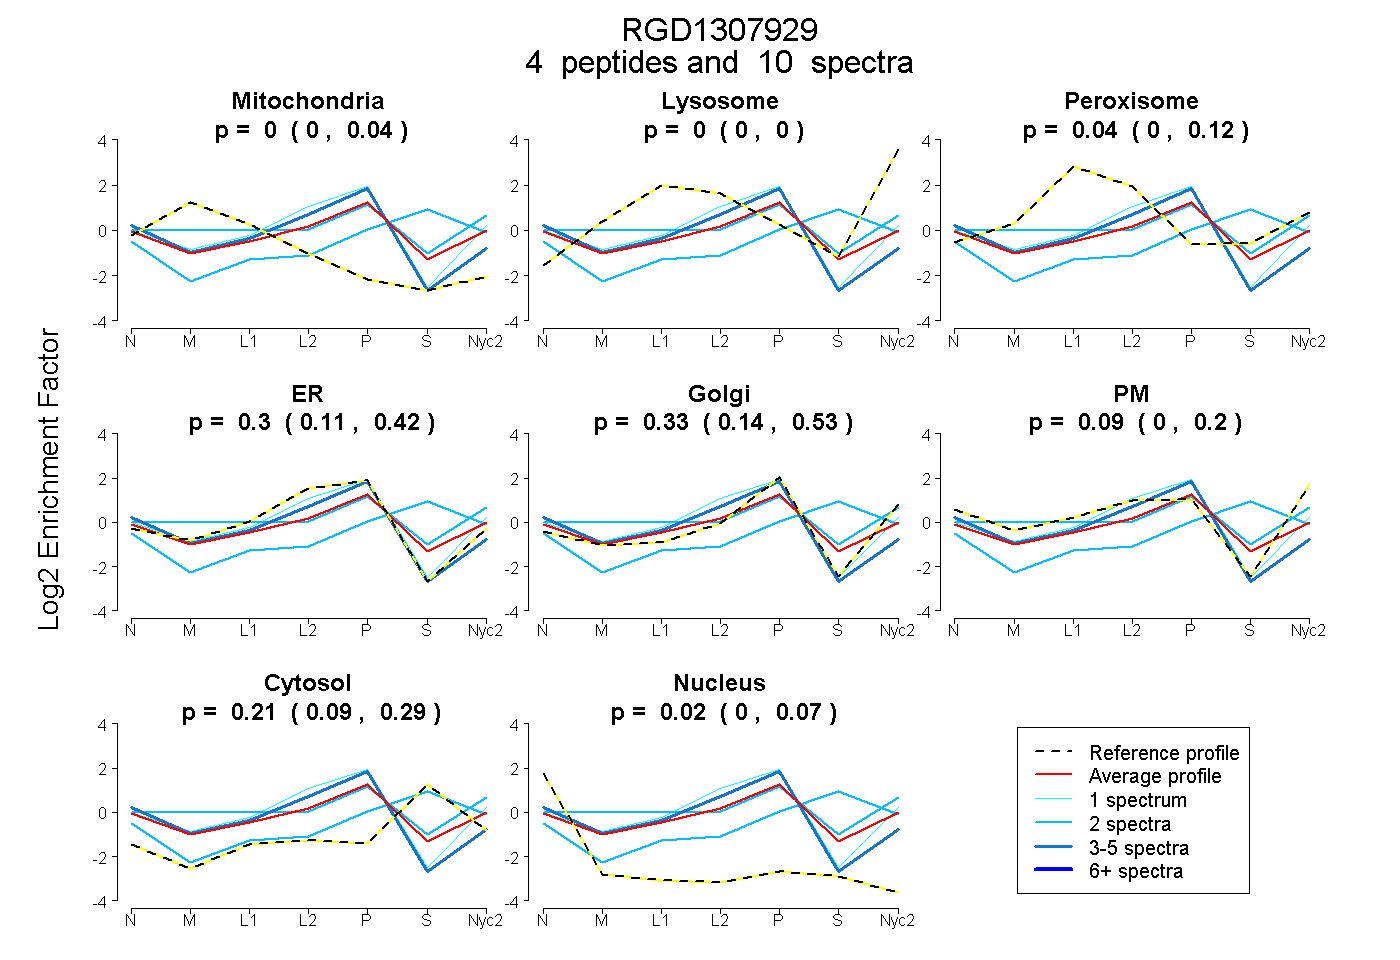
| Plot | Mito | Lyso | Perox | ER | Golgi | PM | Cytosol | Nucleus | |||||
| Expt A |
4 peptides |
10 spectra |
|
0.000 0.000 | 0.041 |
0.000 0.000 | 0.000 |
0.043 0.000 | 0.124 |
0.296 0.112 | 0.418 |
0.335 0.135 | 0.534 |
0.094 0.000 | 0.203 |
0.211 0.092 | 0.289 |
0.021 0.000 | 0.067 |
||
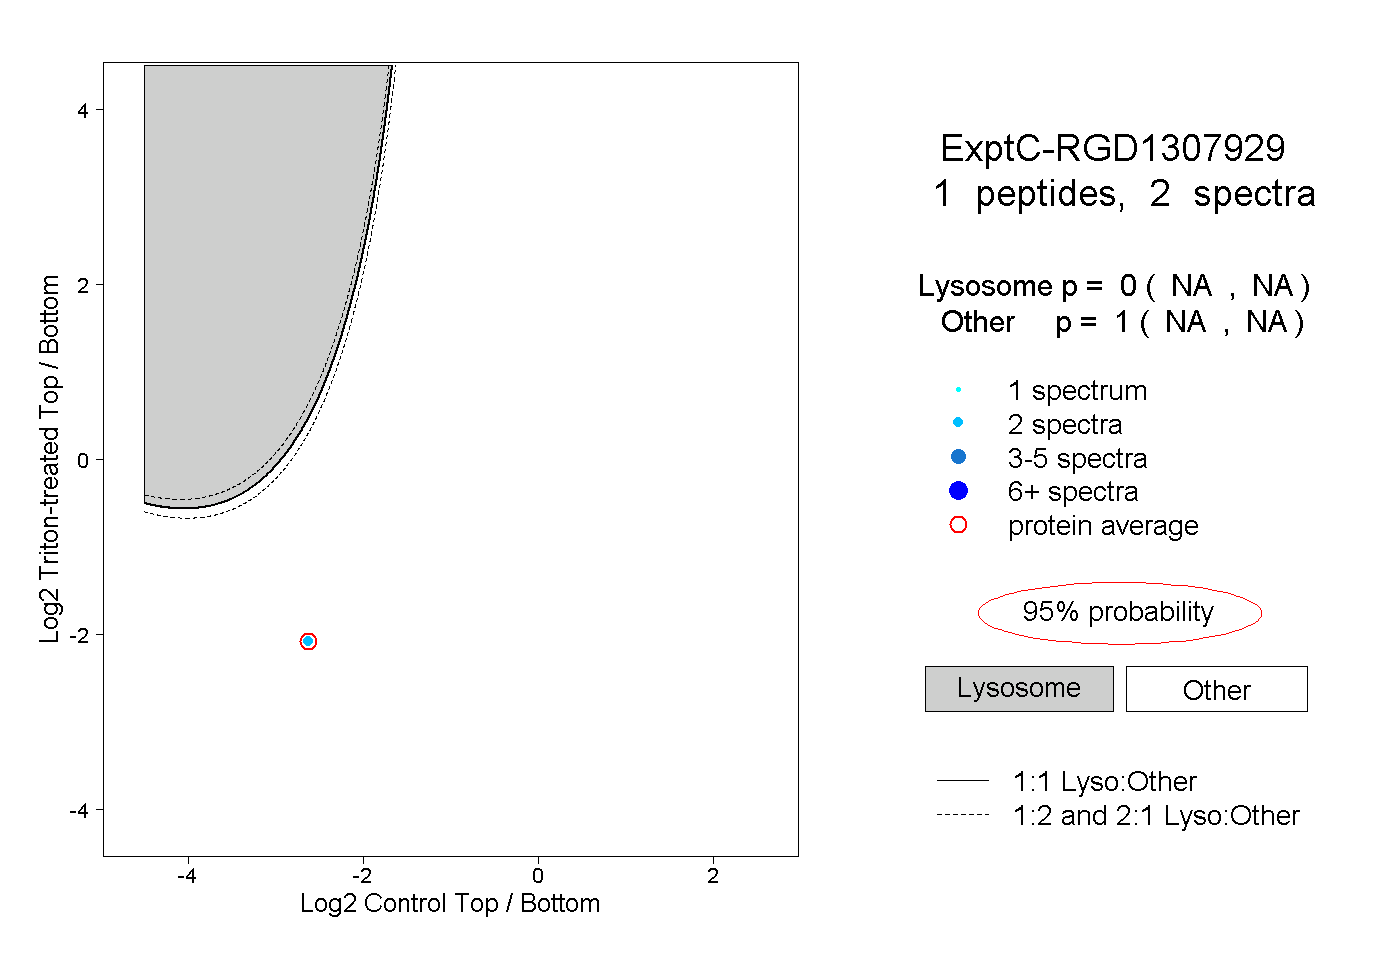
| Plot | Lyso | Other | |||||||||||
| Expt C |
1 peptide |
2 spectra |
|
0.000 NA | NA |
1.000 NA | NA |