 3
3peptides
spectra
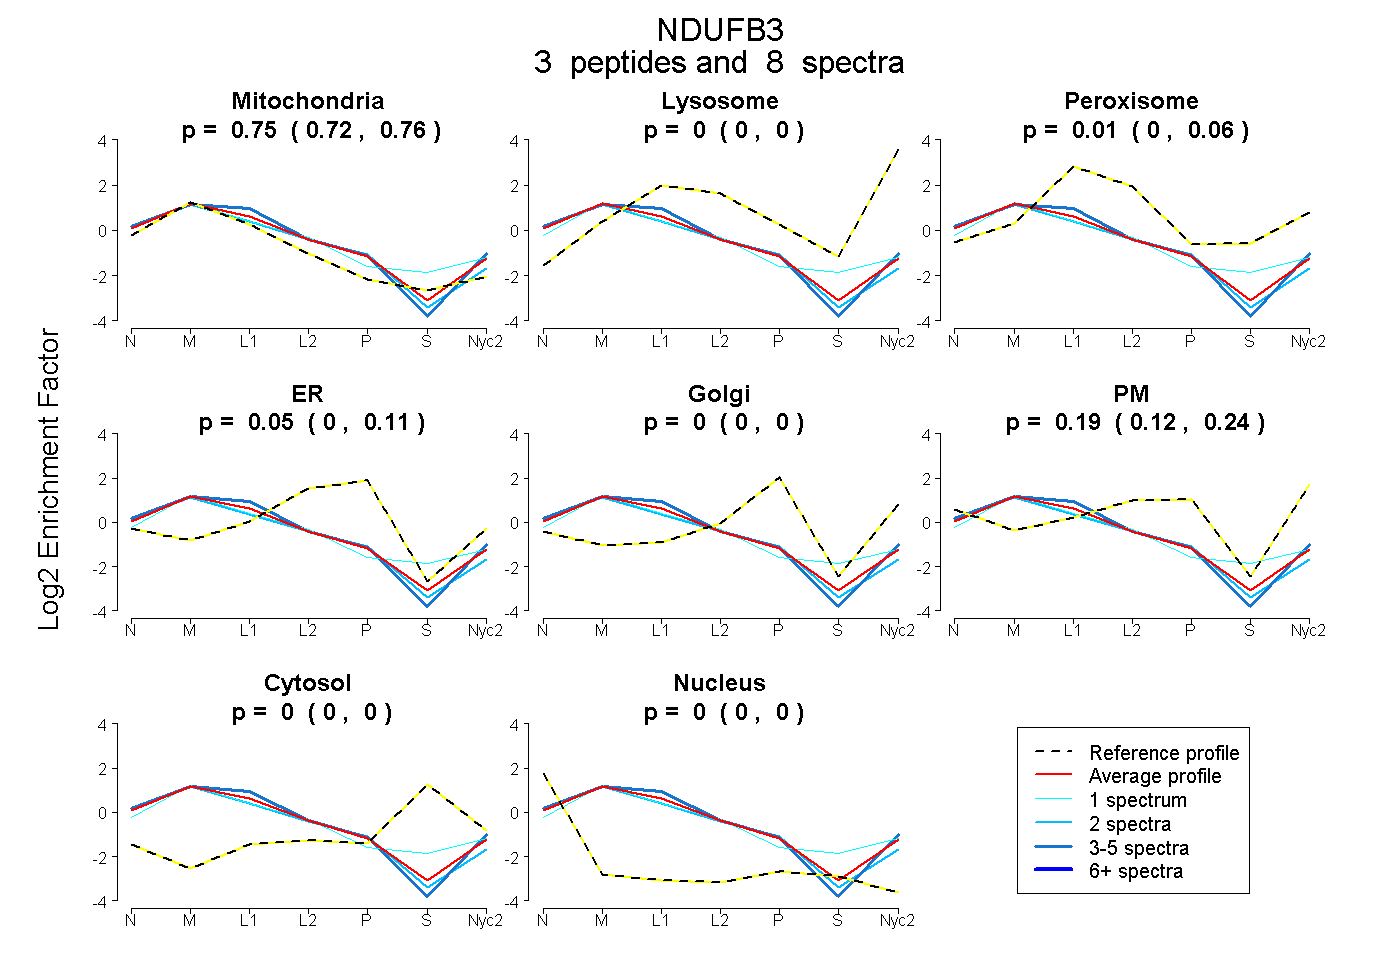
0.717 | 0.763
0.000 | 0.000
0.000 | 0.057
0.000 | 0.106
0.000 | 0.000
0.119 | 0.238
0.000 | 0.000
0.000 | 0.000
2peptides
spectra
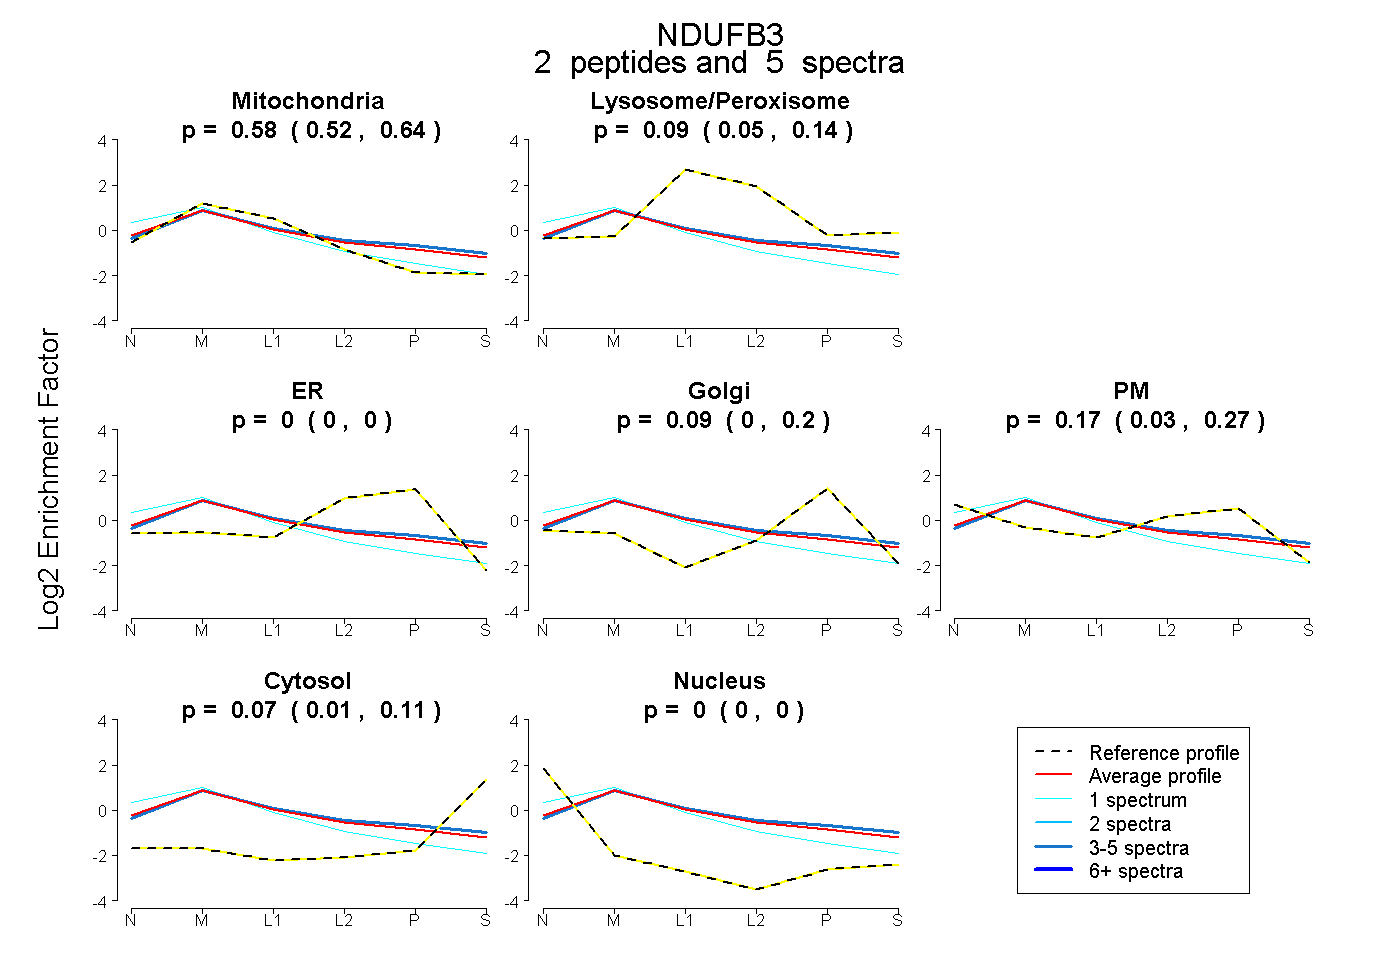
0.523 | 0.638
0.046 | 0.141
0.000 | 0.000
0.000 | 0.203
0.034 | 0.266
0.012 | 0.107
0.000 | 0.000
3peptides
spectra
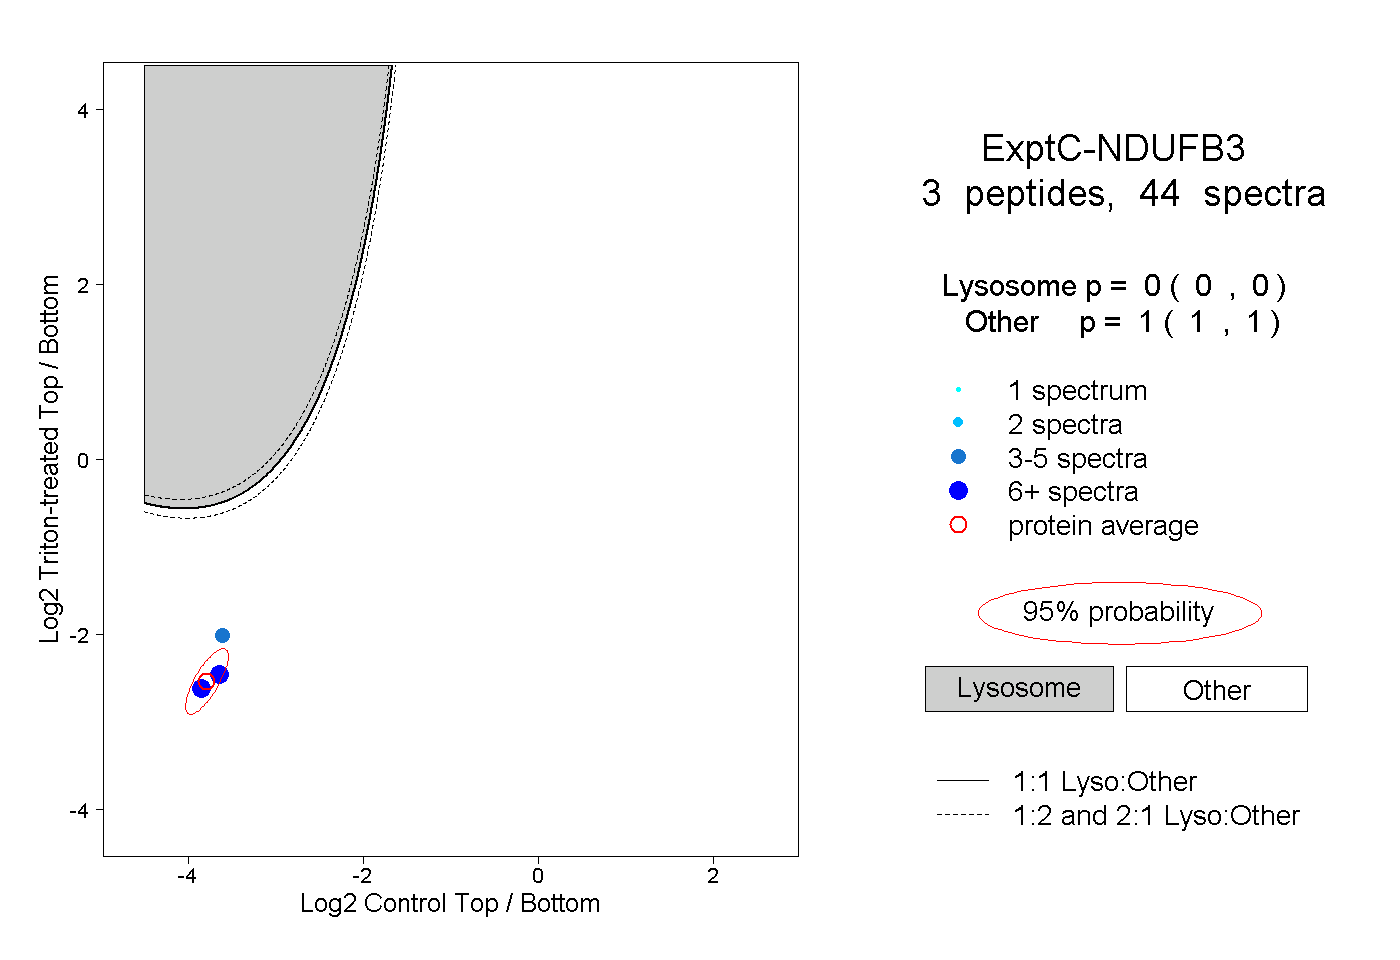
0.000 | 0.000
1.000 | 1.000
2peptides
spectra
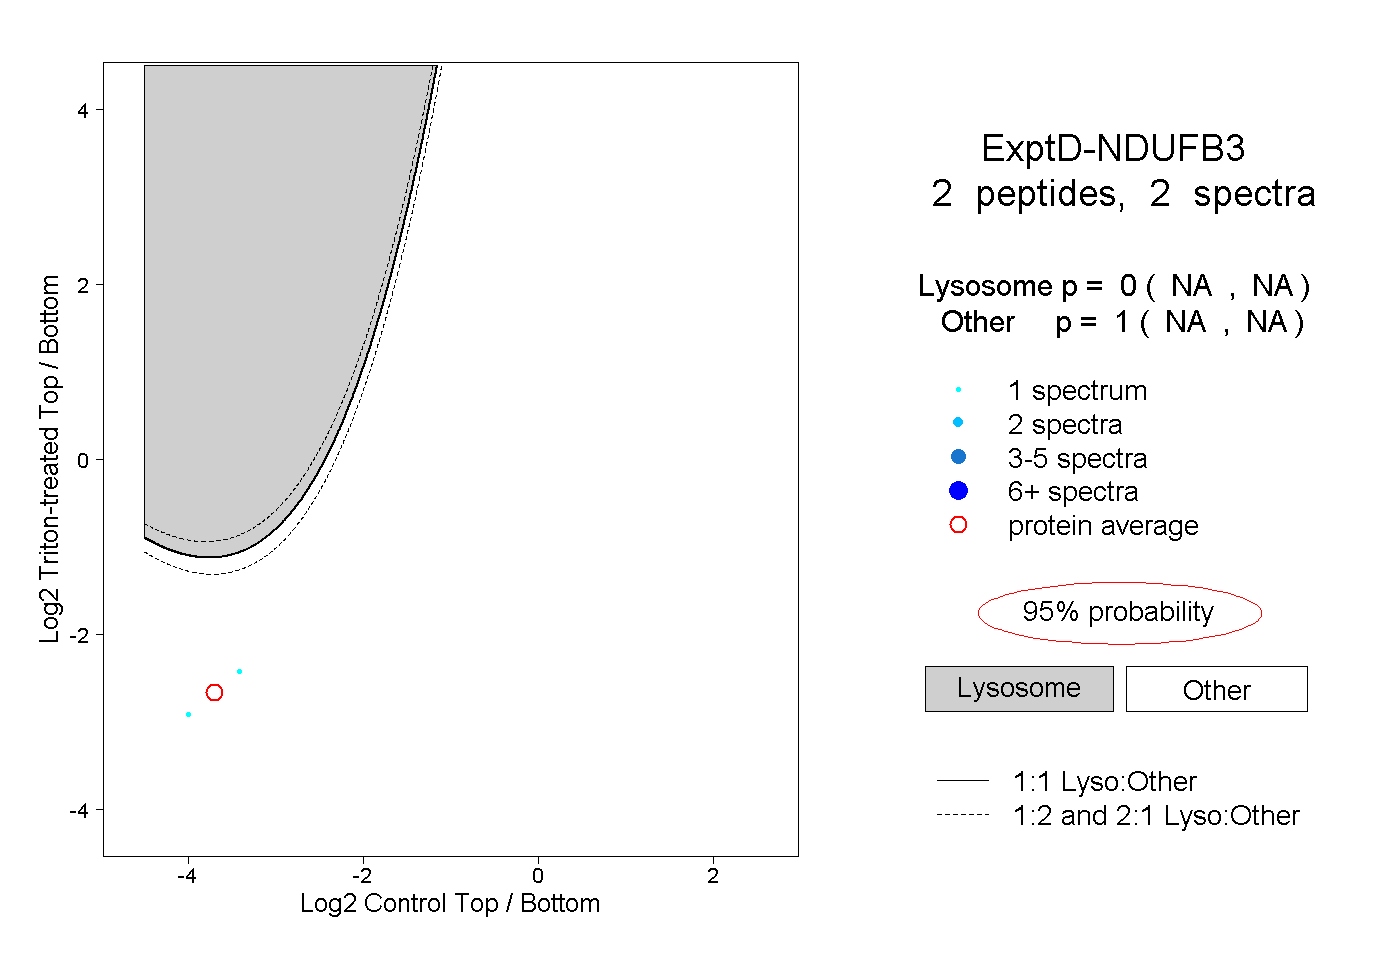
NA | NA
NA | NA