 5
5peptides
spectra
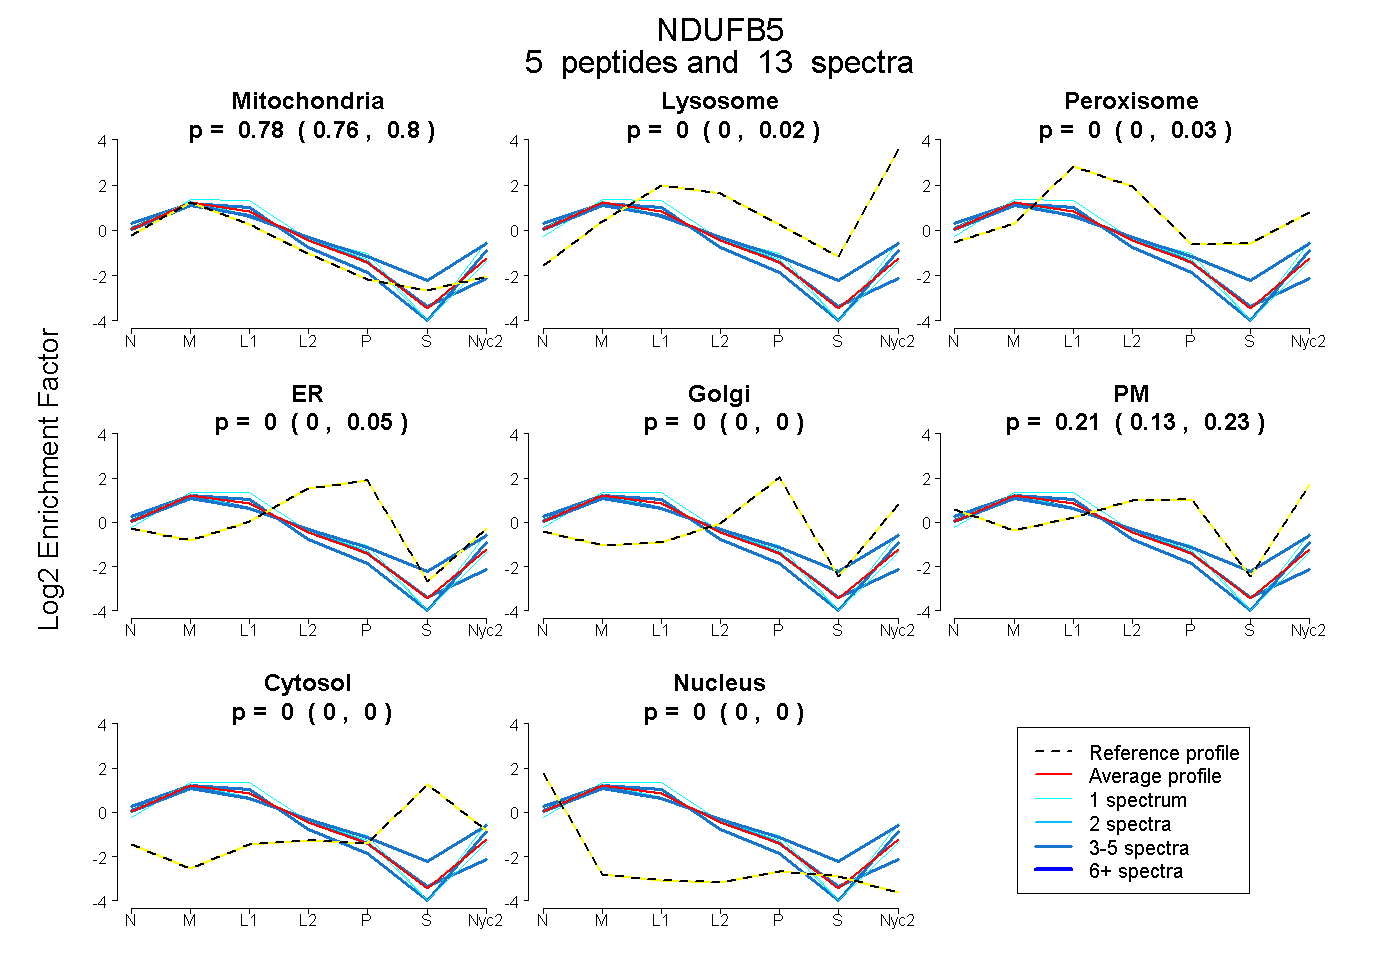
0.758 | 0.803
0.000 | 0.020
0.000 | 0.028
0.000 | 0.051
0.000 | 0.000
0.130 | 0.227
0.000 | 0.000
0.000 | 0.000
4peptides
spectra
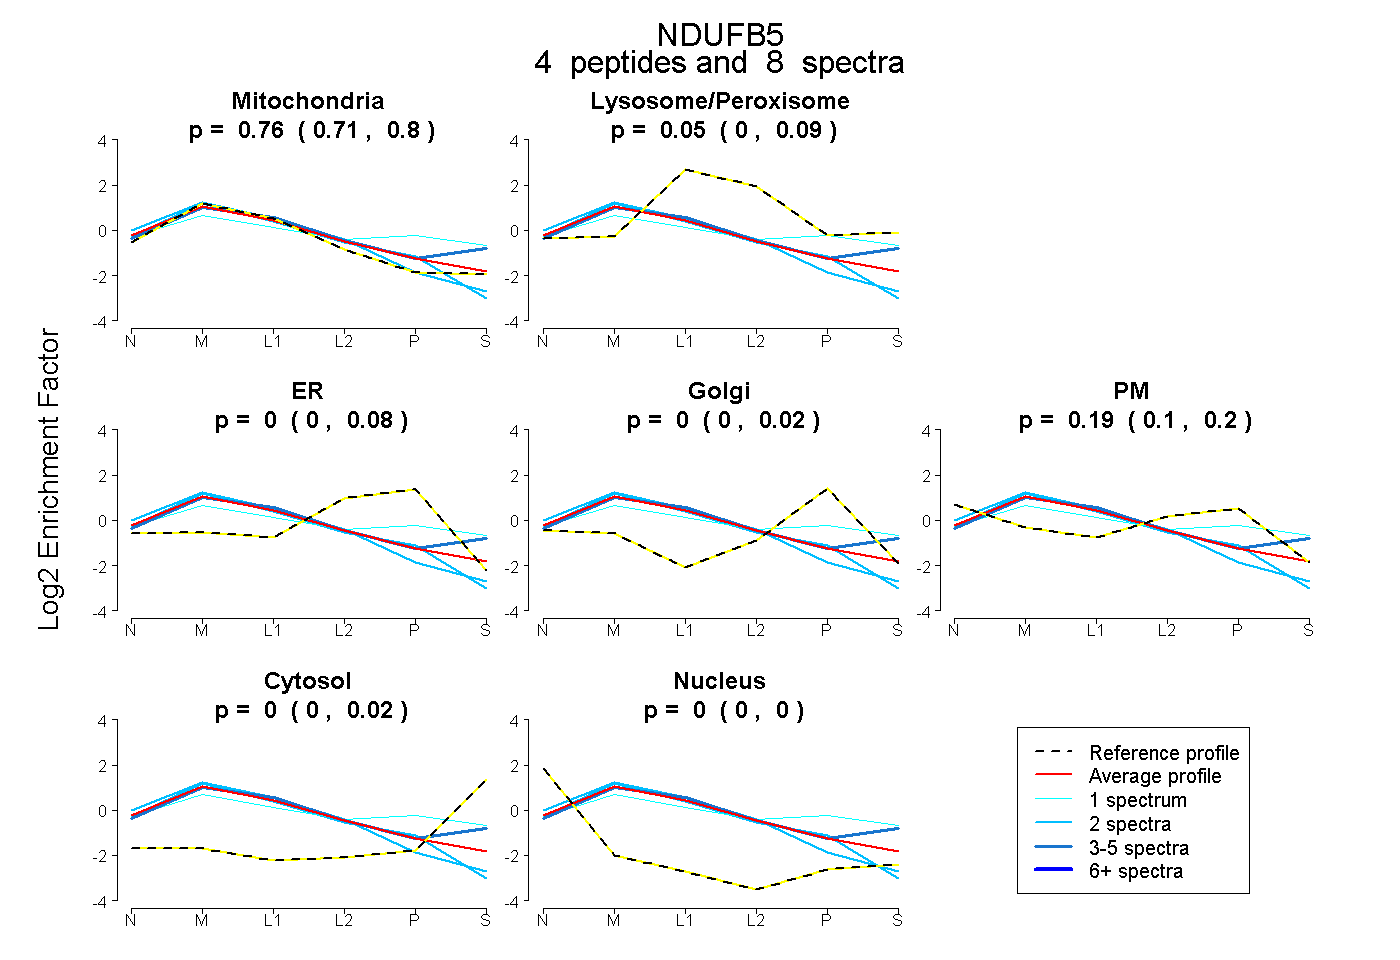
0.711 | 0.802
0.000 | 0.092
0.000 | 0.078
0.000 | 0.018
0.103 | 0.199
0.000 | 0.015
0.000 | 0.000
5peptides
spectra
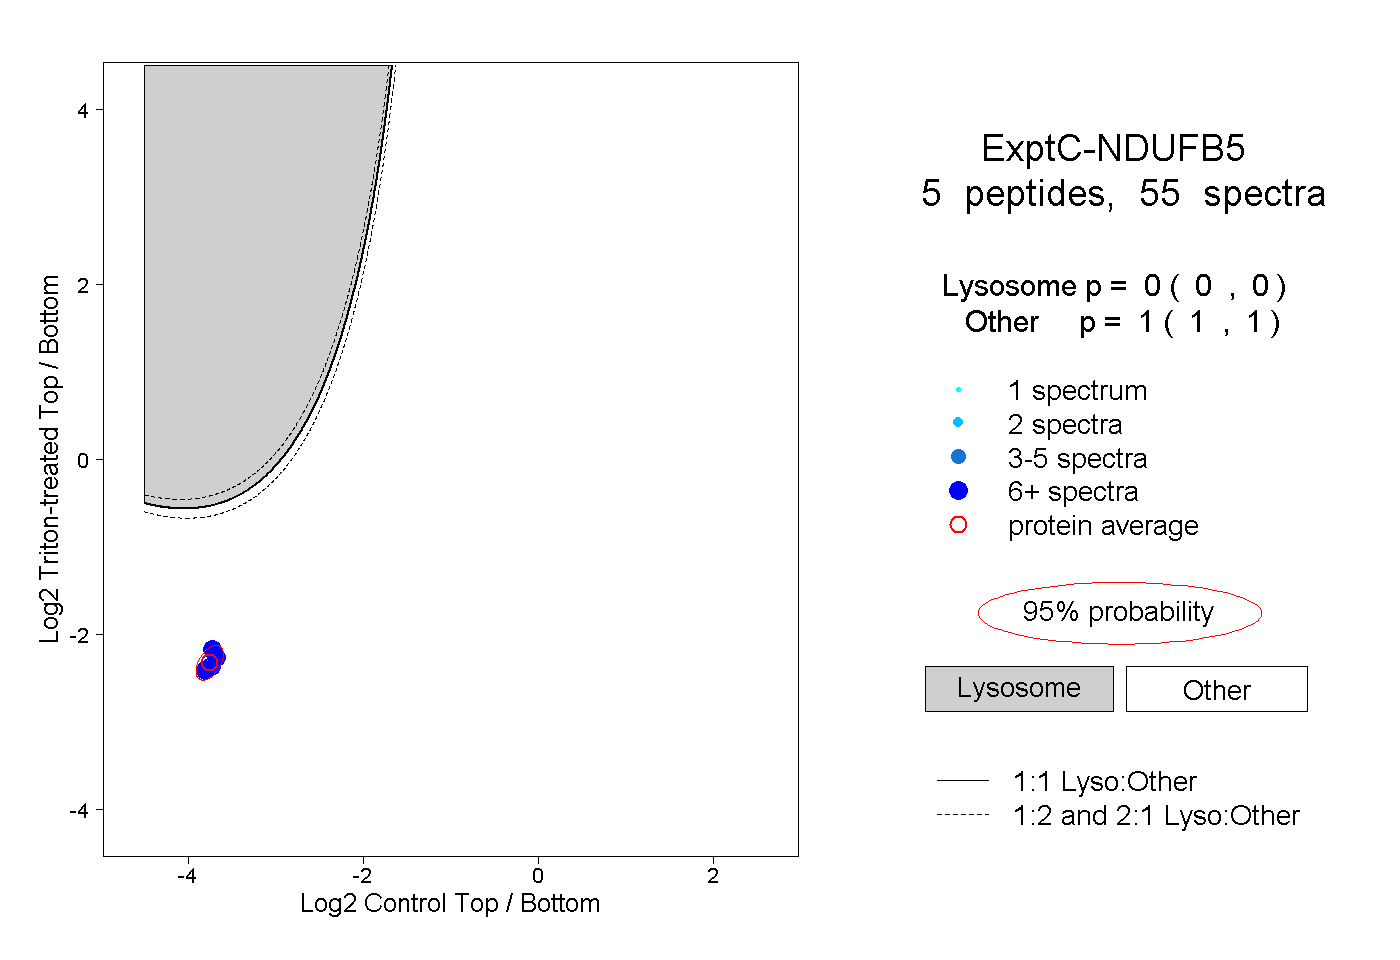
0.000 | 0.000
1.000 | 1.000
1peptide
spectrum
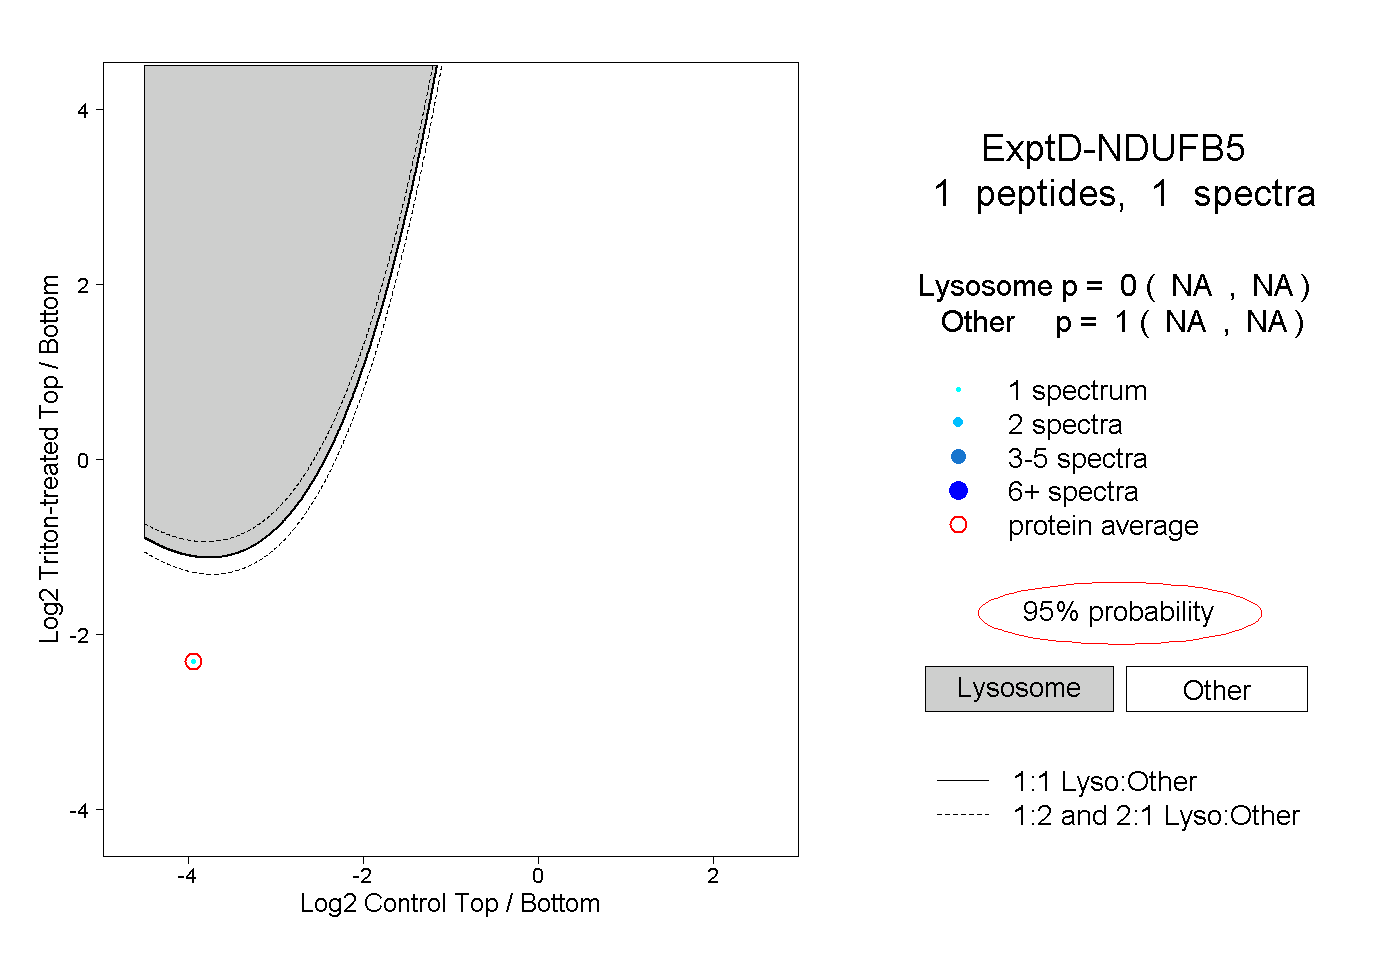
NA | NA
NA | NA