 4
4peptides
spectra
0.000 | 0.255
0.230 | 0.669
0.000 | 0.096
0.000 | 0.052
0.000 | 0.225
0.000 | 0.482
0.000 | 0.092
0.000 | 0.187
1peptide
spectra
NA | NA
NA | NA
| Plot | Mito | Lyso | Perox | ER | Golgi | PM | Cytosol | Nucleus | |||||
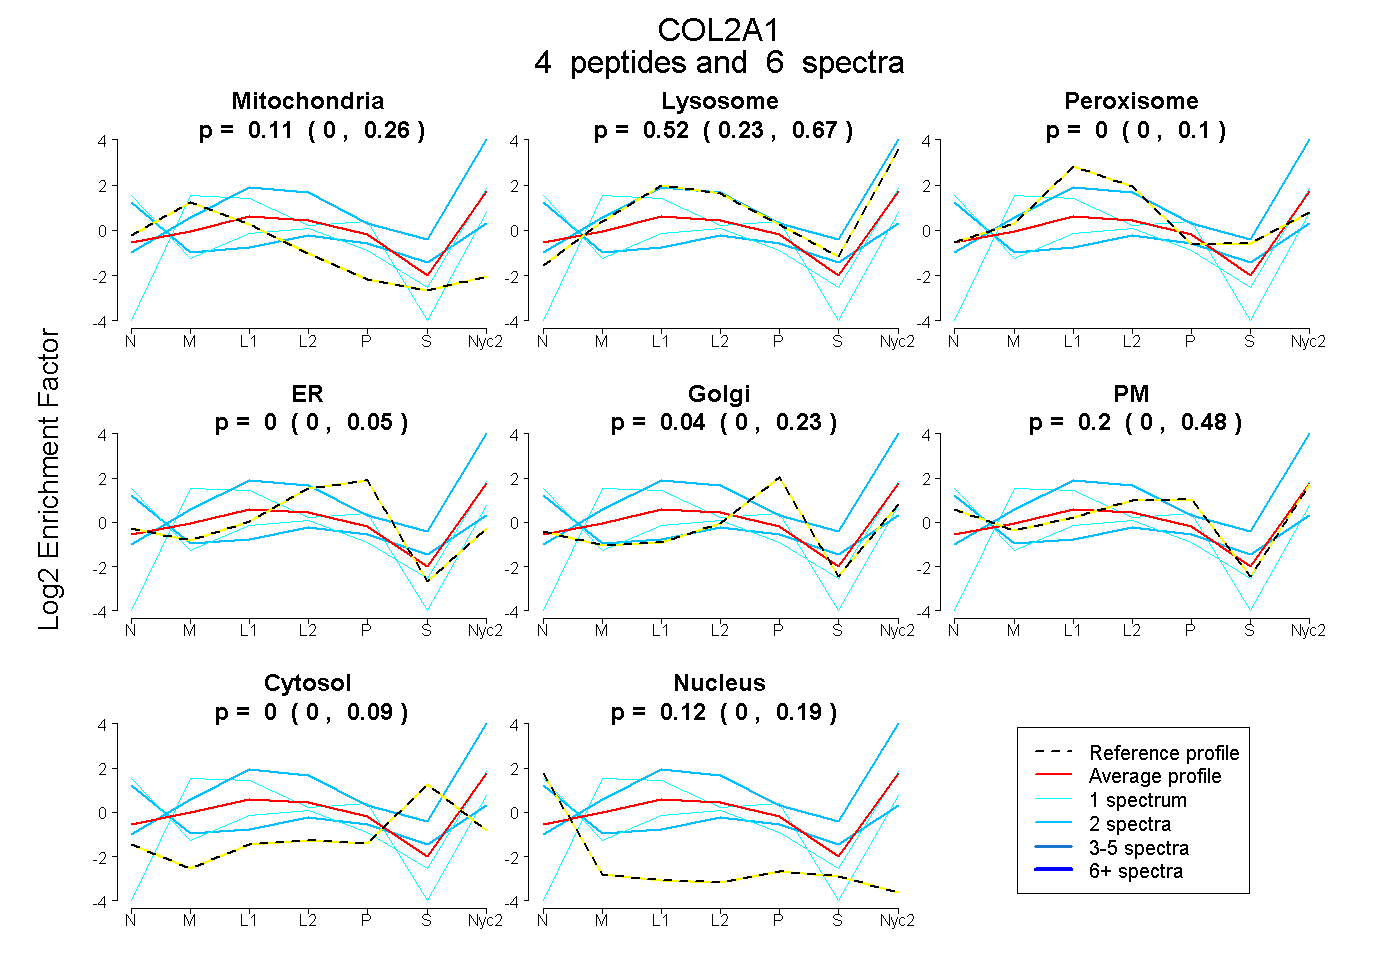
| Expt A |
4 peptides |
6 spectra |
|
0.111 0.000 | 0.255 |
0.524 0.230 | 0.669 |
0.000 0.000 | 0.096 |
0.000 0.000 | 0.052 |
0.044 0.000 | 0.225 |
0.200 0.000 | 0.482 |
0.000 0.000 | 0.092 |
0.120 0.000 | 0.187 |
||
| Plot | Lyso | Other | |||||||||||
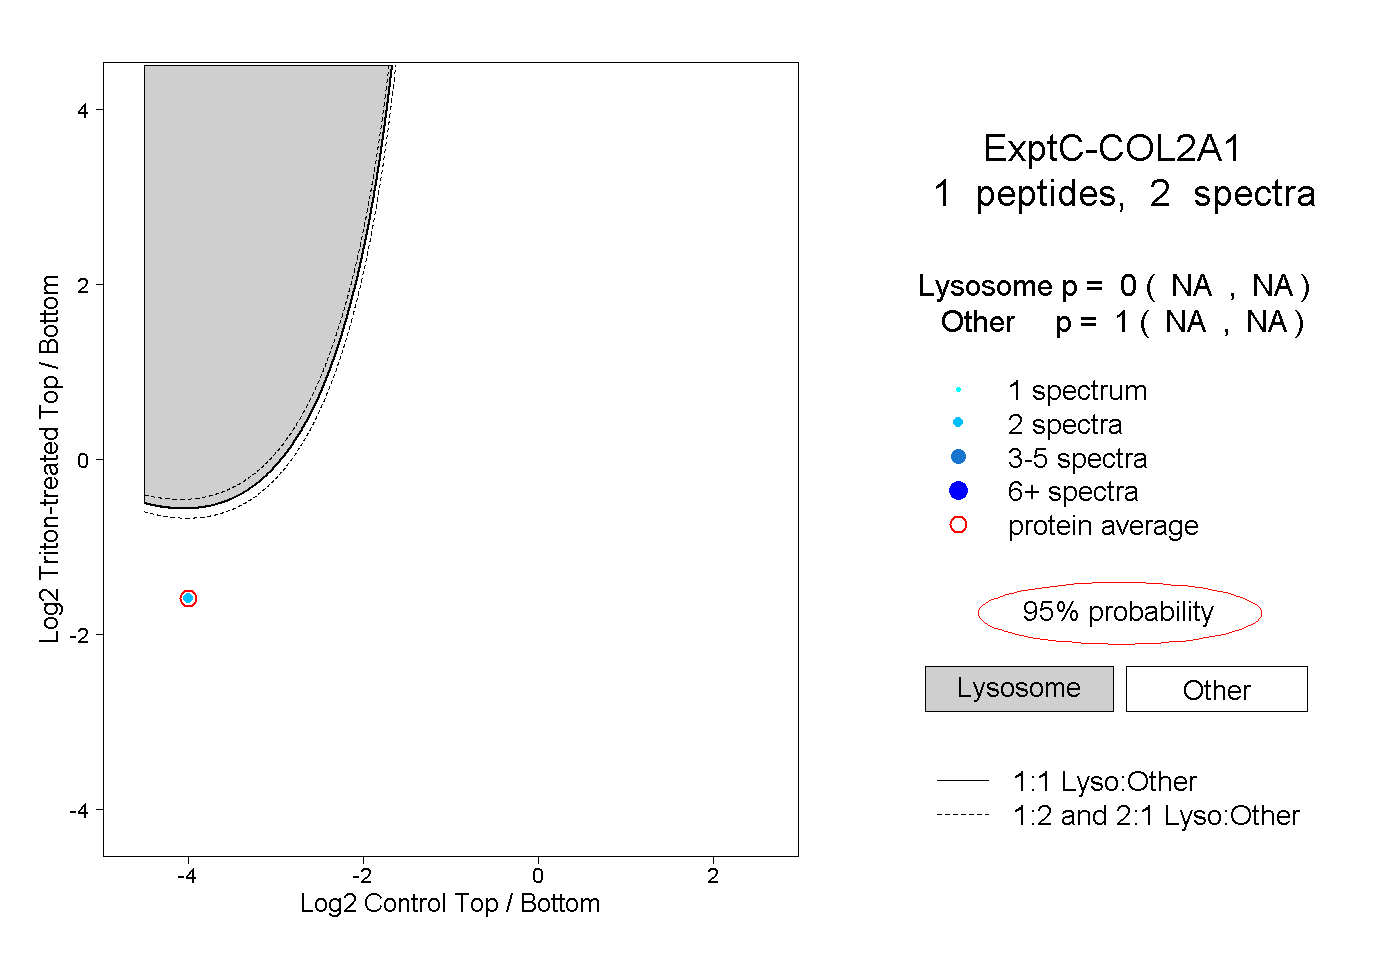
| Expt C |
1 peptide |
2 spectra |
|
0.000 NA | NA |
1.000 NA | NA |