 2
2peptides
spectra
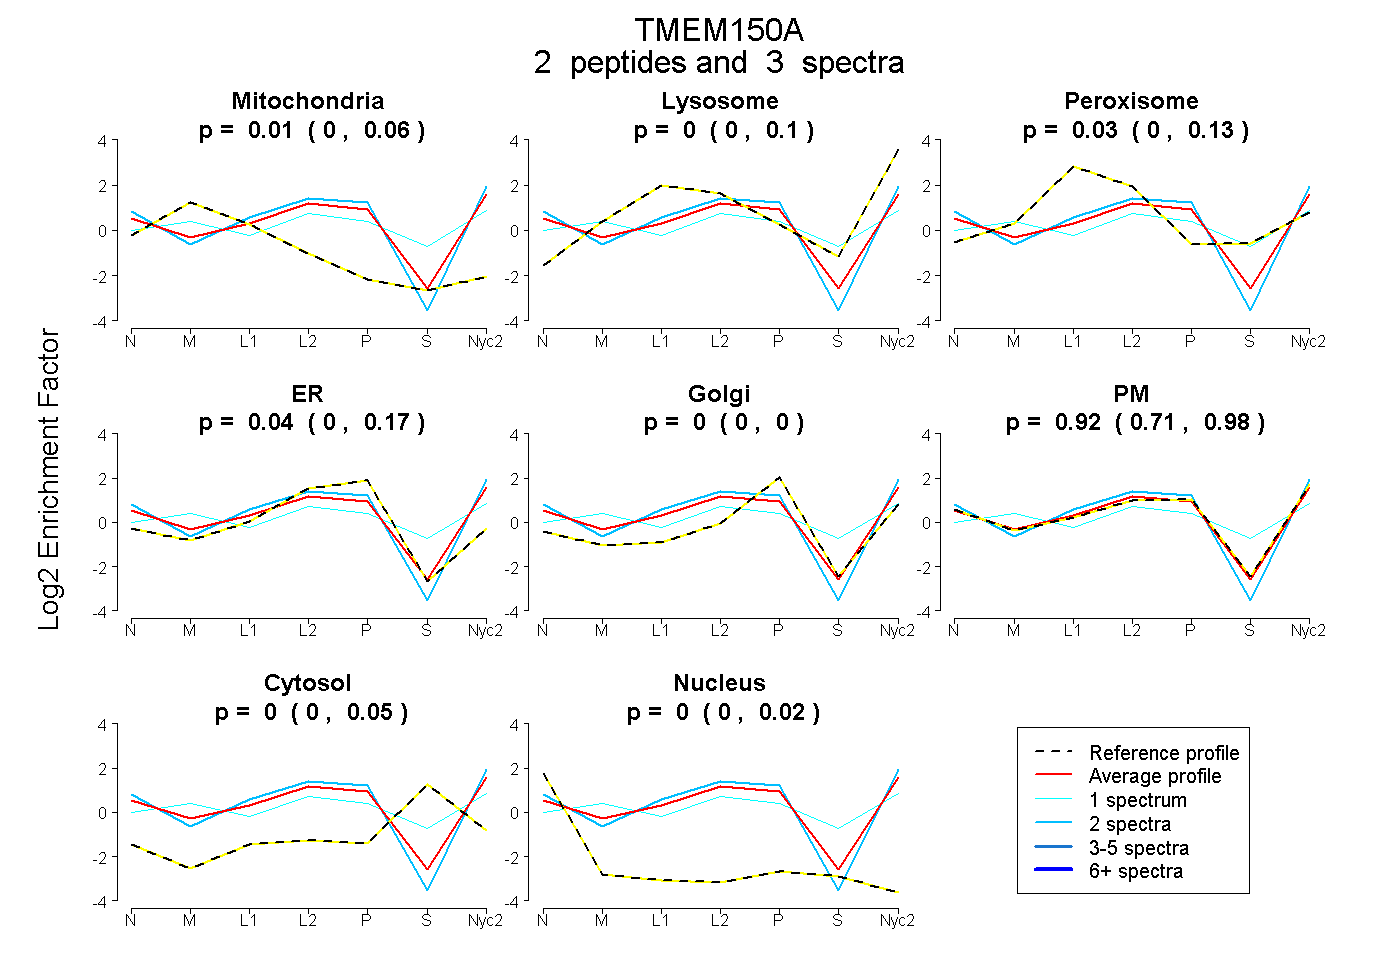
0.000 | 0.058
0.000 | 0.098
0.000 | 0.126
0.000 | 0.171
0.000 | 0.002
0.706 | 0.979
0.000 | 0.054
0.000 | 0.020
1peptide
spectrum
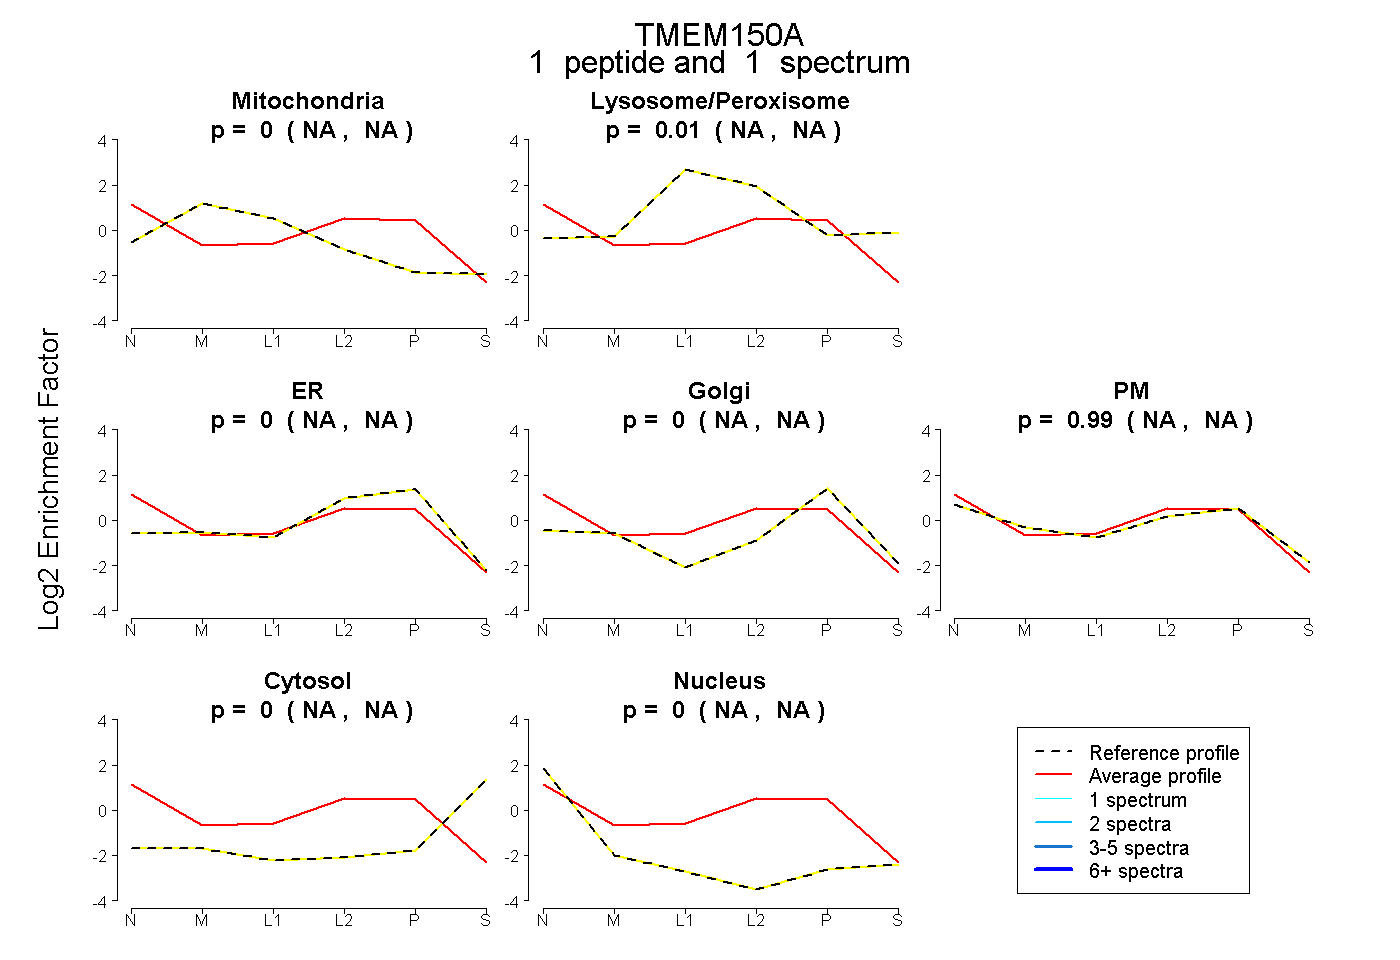
NA | NA
NA | NA
NA | NA
NA | NA
NA | NA
NA | NA
NA | NA
1peptide
spectra
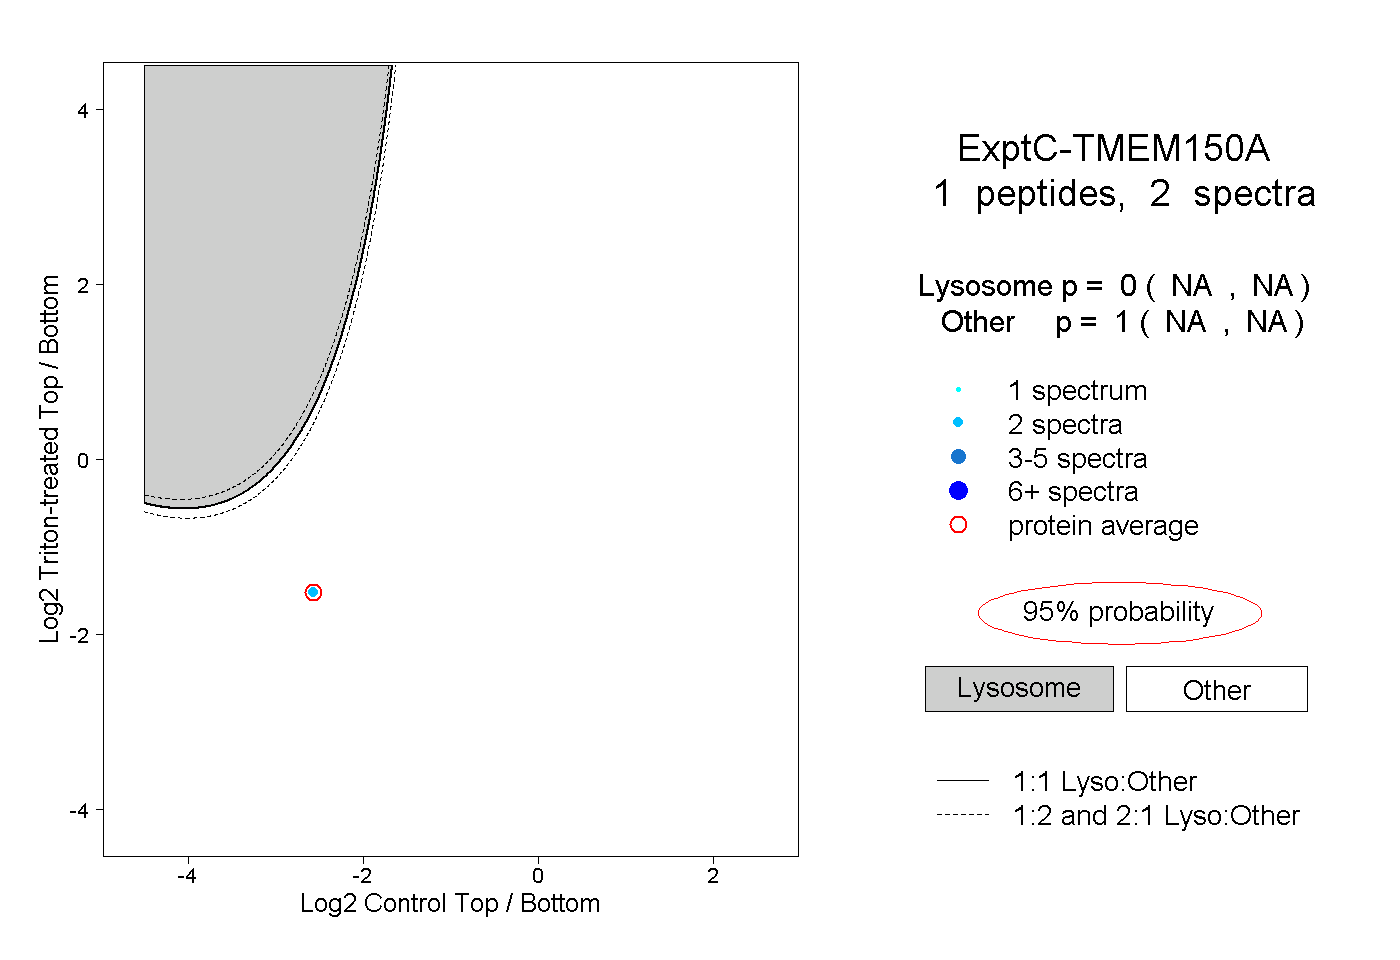
NA | NA
NA | NA
2peptides
spectra
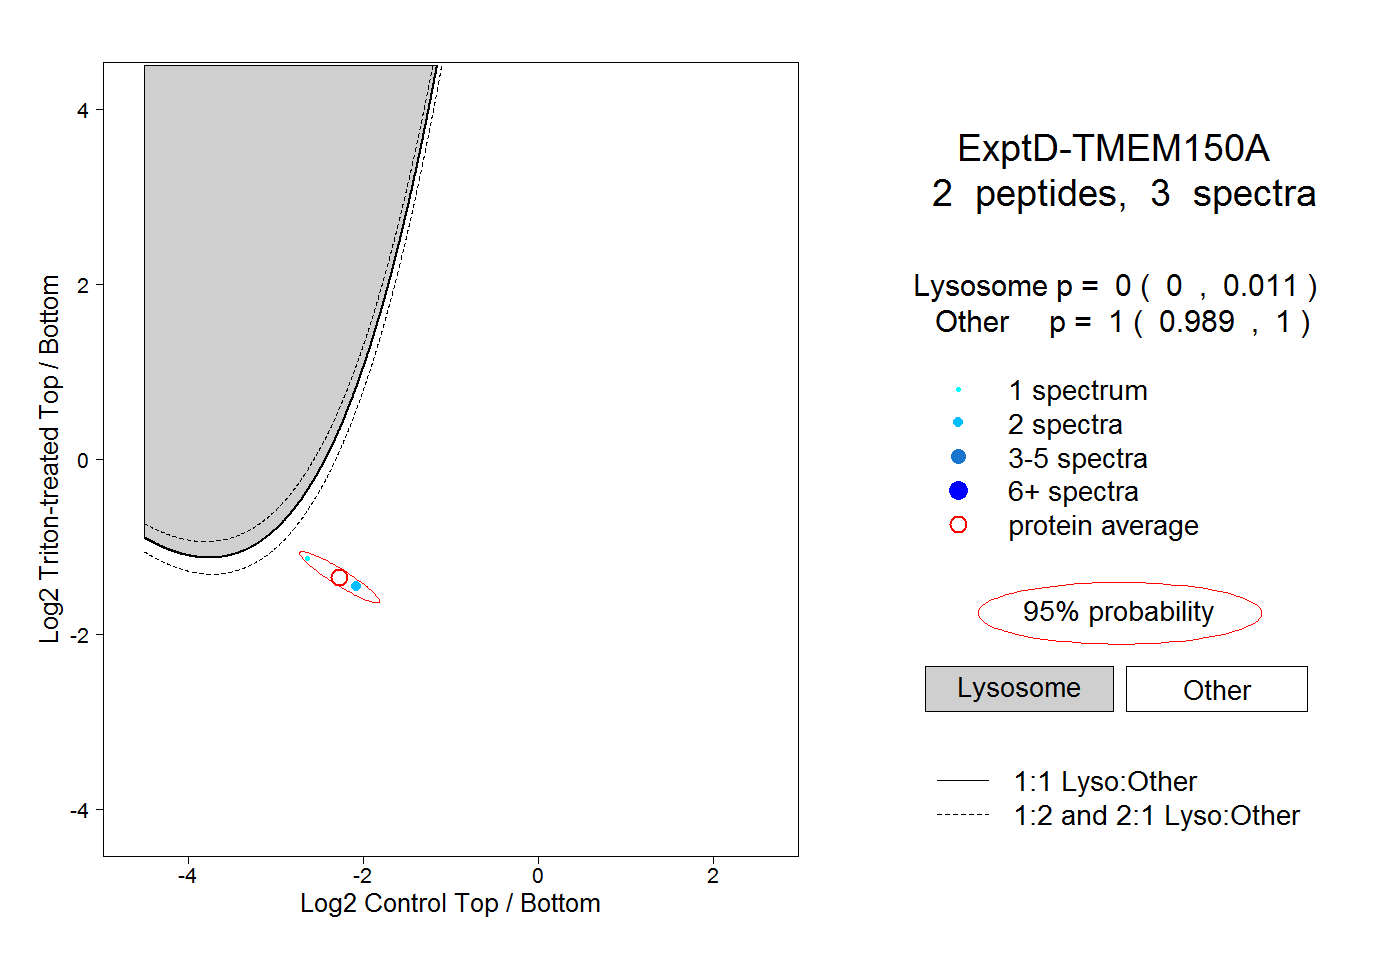
0.000 | 0.011
0.989 | 1.000