 1
1peptide
spectra
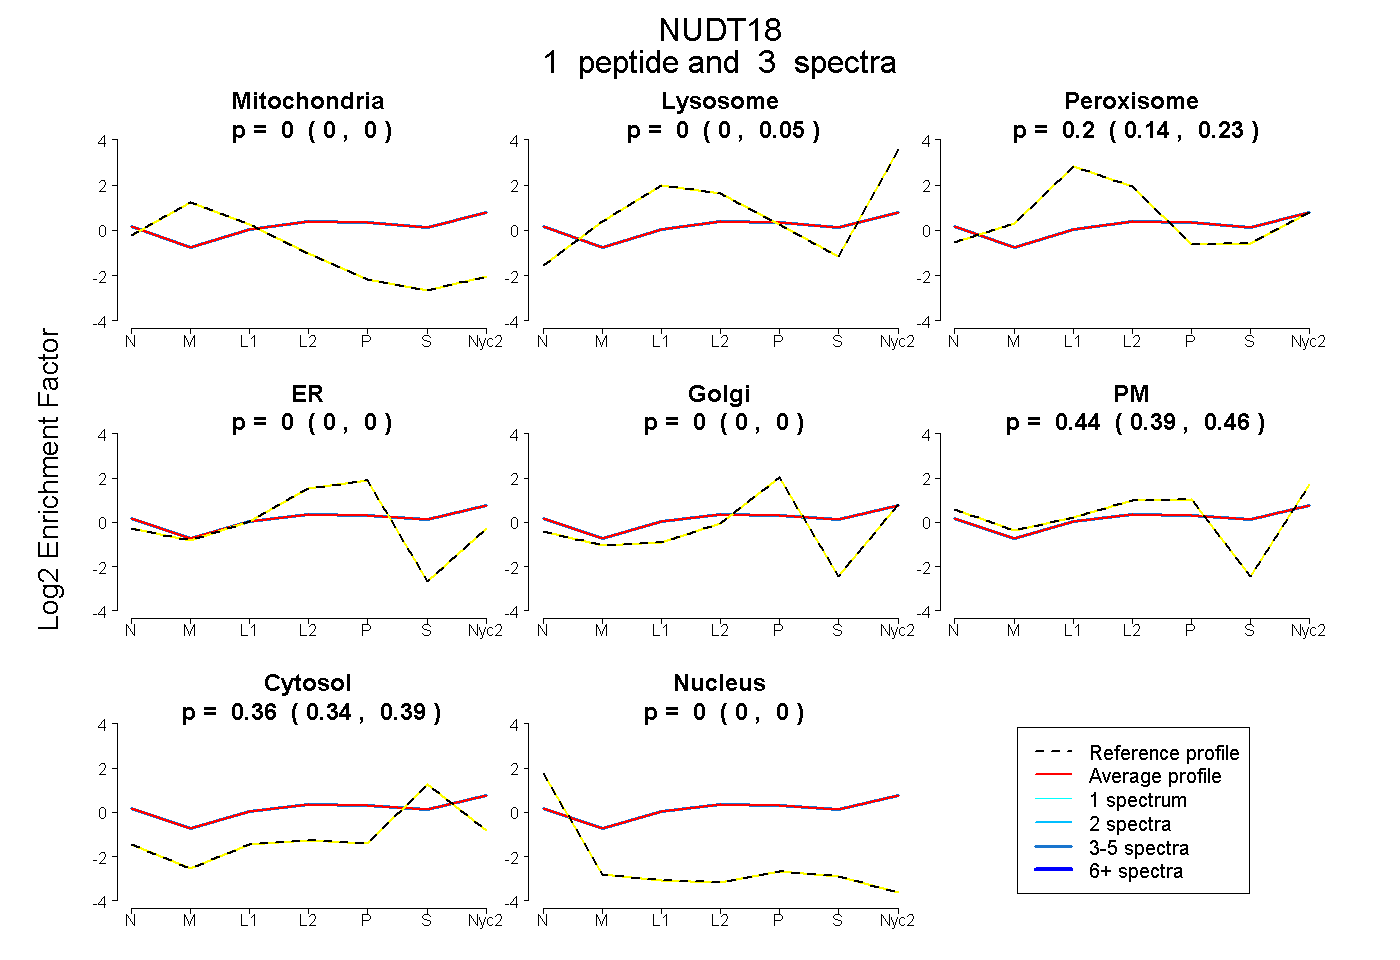
0.000 | 0.000
0.000 | 0.052
0.137 | 0.227
0.000 | 0.000
0.000 | 0.000
0.394 | 0.465
0.339 | 0.388
0.000 | 0.000
1peptide
spectrum
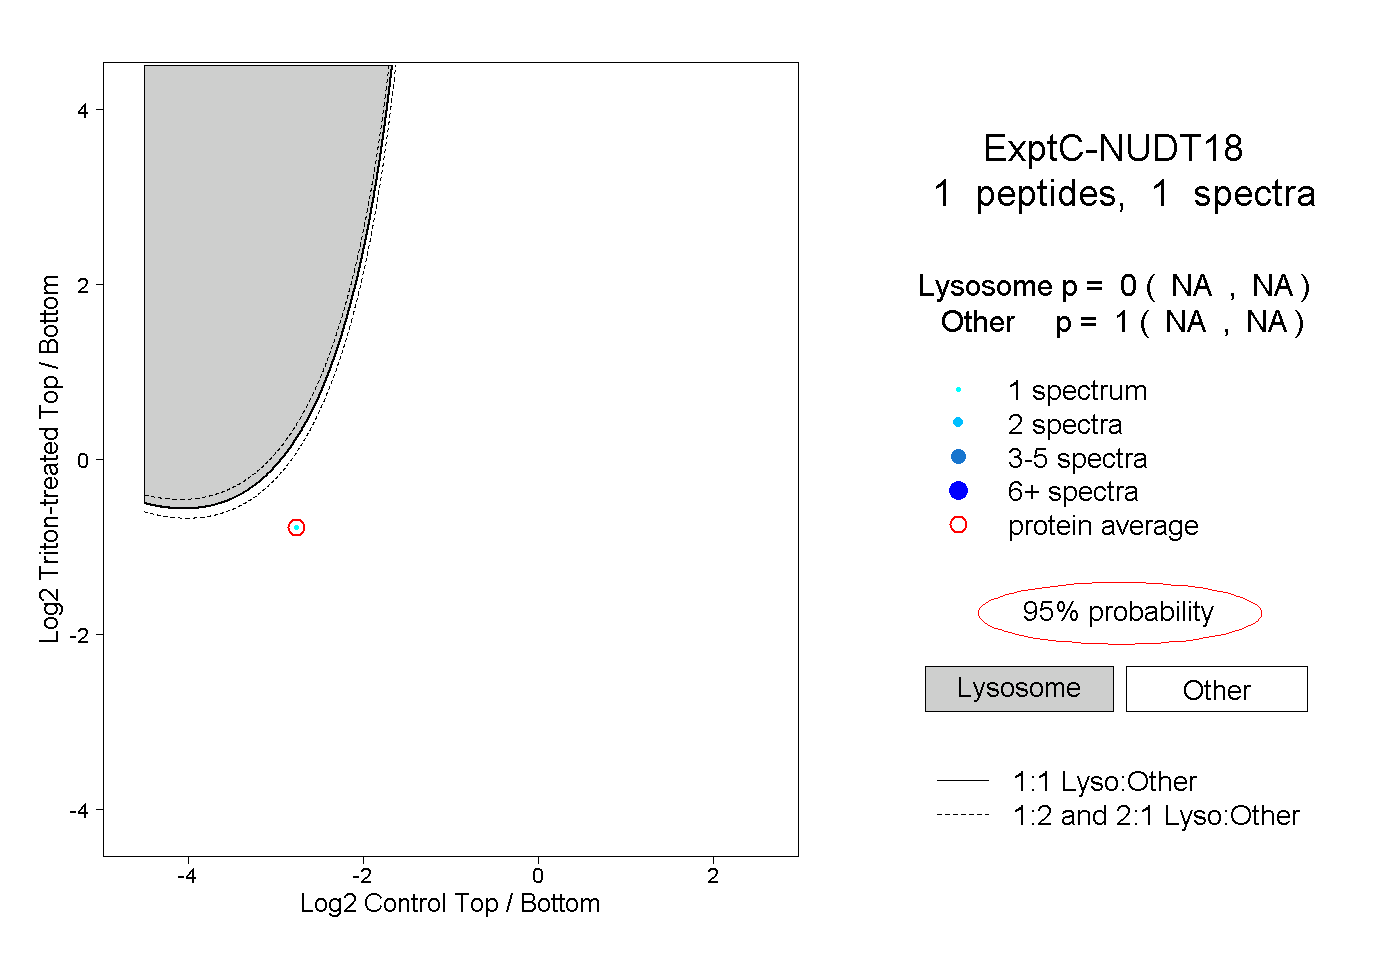
NA | NA
NA | NA
| Plot | Mito | Lyso | Perox | ER | Golgi | PM | Cytosol | Nucleus | |||||
| Expt A |
1 peptide |
3 spectra |
|
0.000 0.000 | 0.000 |
0.002 0.000 | 0.052 |
0.197 0.137 | 0.227 |
0.000 0.000 | 0.000 |
0.000 0.000 | 0.000 |
0.437 0.394 | 0.465 |
0.364 0.339 | 0.388 |
0.000 0.000 | 0.000 |
||
| Plot | Lyso | Other | |||||||||||
| Expt C |
1 peptide |
1 spectrum |
|
0.000 NA | NA |
1.000 NA | NA |