 2
2peptides
spectra
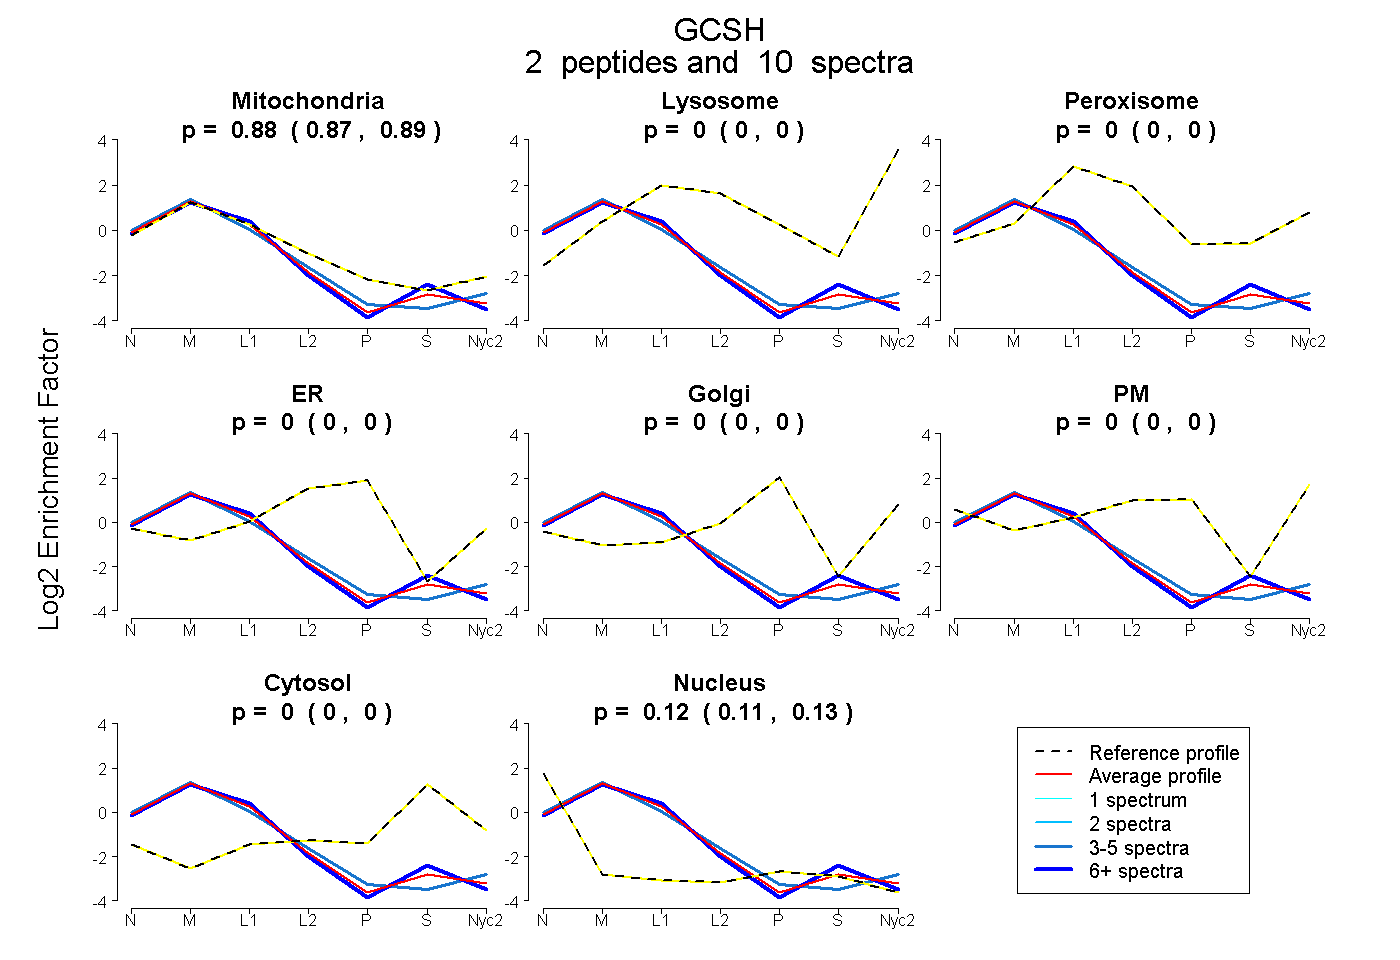
0.872 | 0.893
0.000 | 0.000
0.000 | 0.000
0.000 | 0.000
0.000 | 0.000
0.000 | 0.000
0.000 | 0.000
0.105 | 0.126
2peptides
spectra
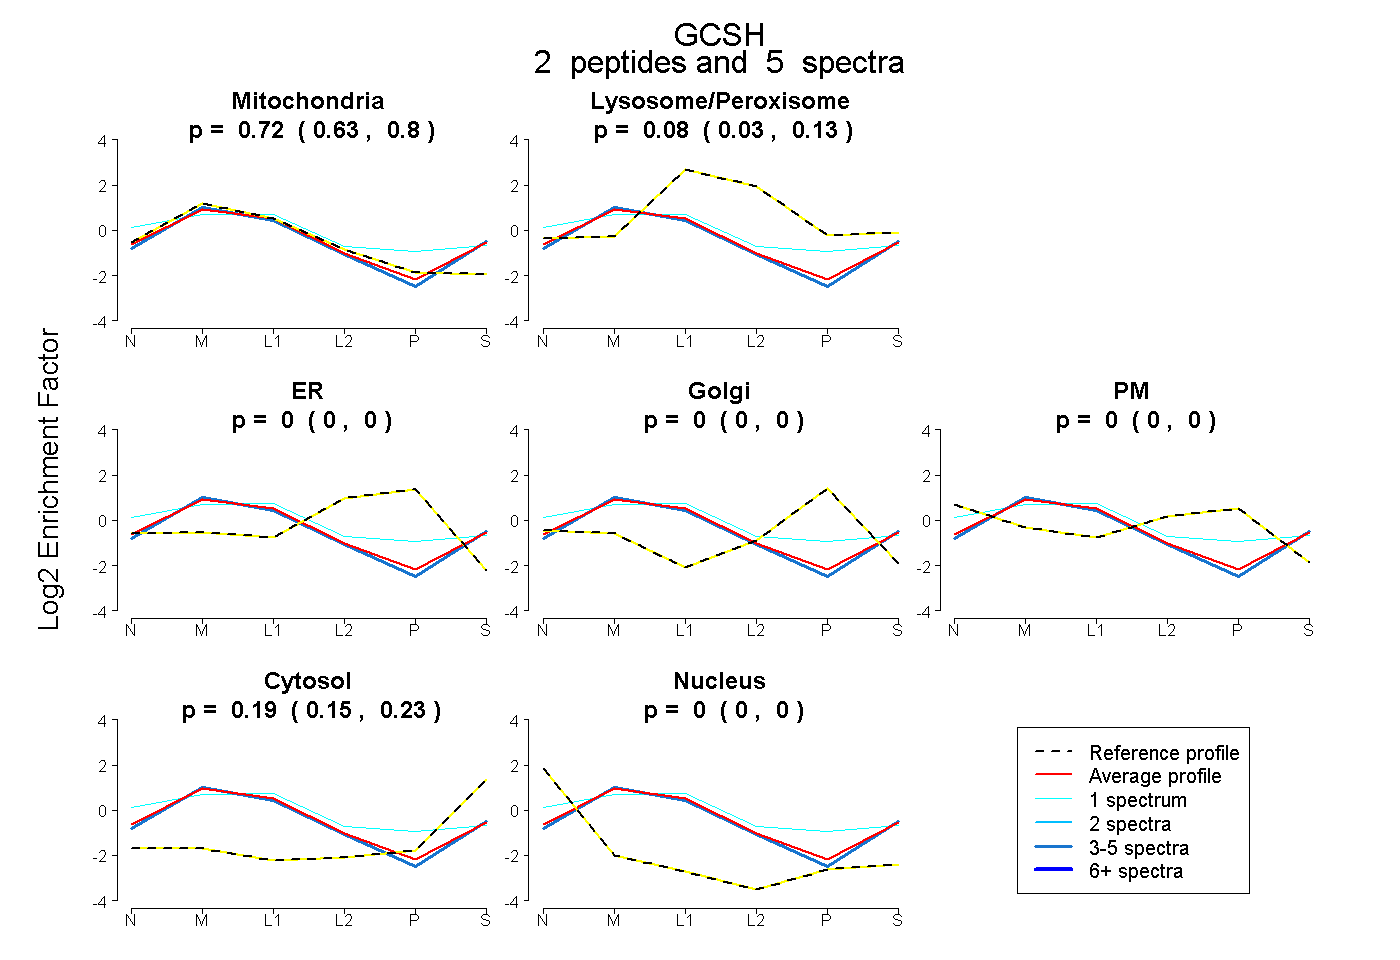
0.634 | 0.797
0.032 | 0.127
0.000 | 0.000
0.000 | 0.000
0.000 | 0.000
0.145 | 0.232
0.000 | 0.000
2peptides
spectra
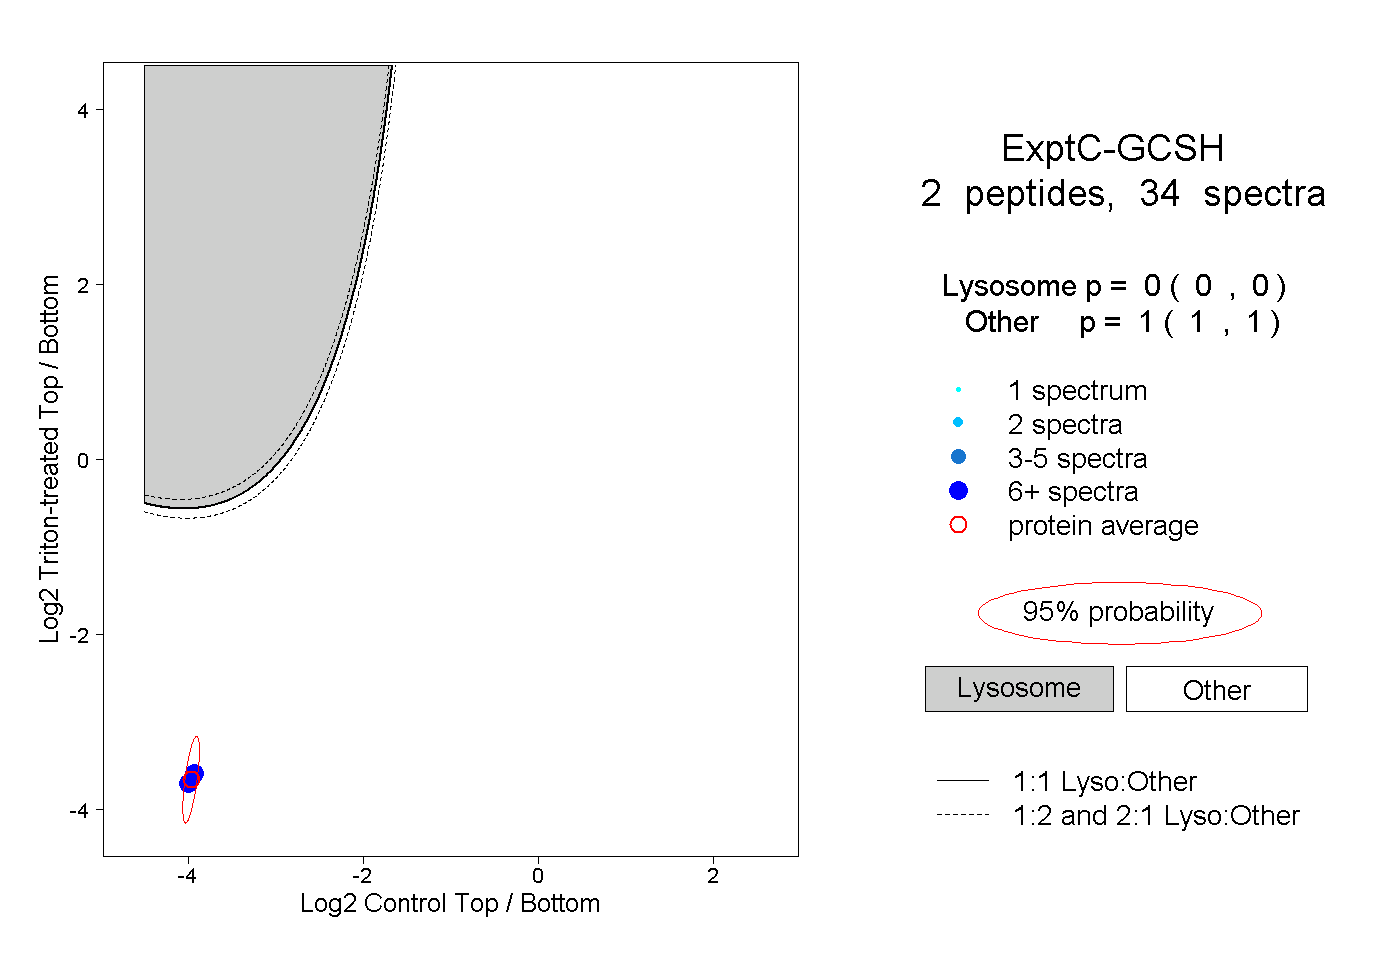
0.000 | 0.000
1.000 | 1.000
2peptides
spectra
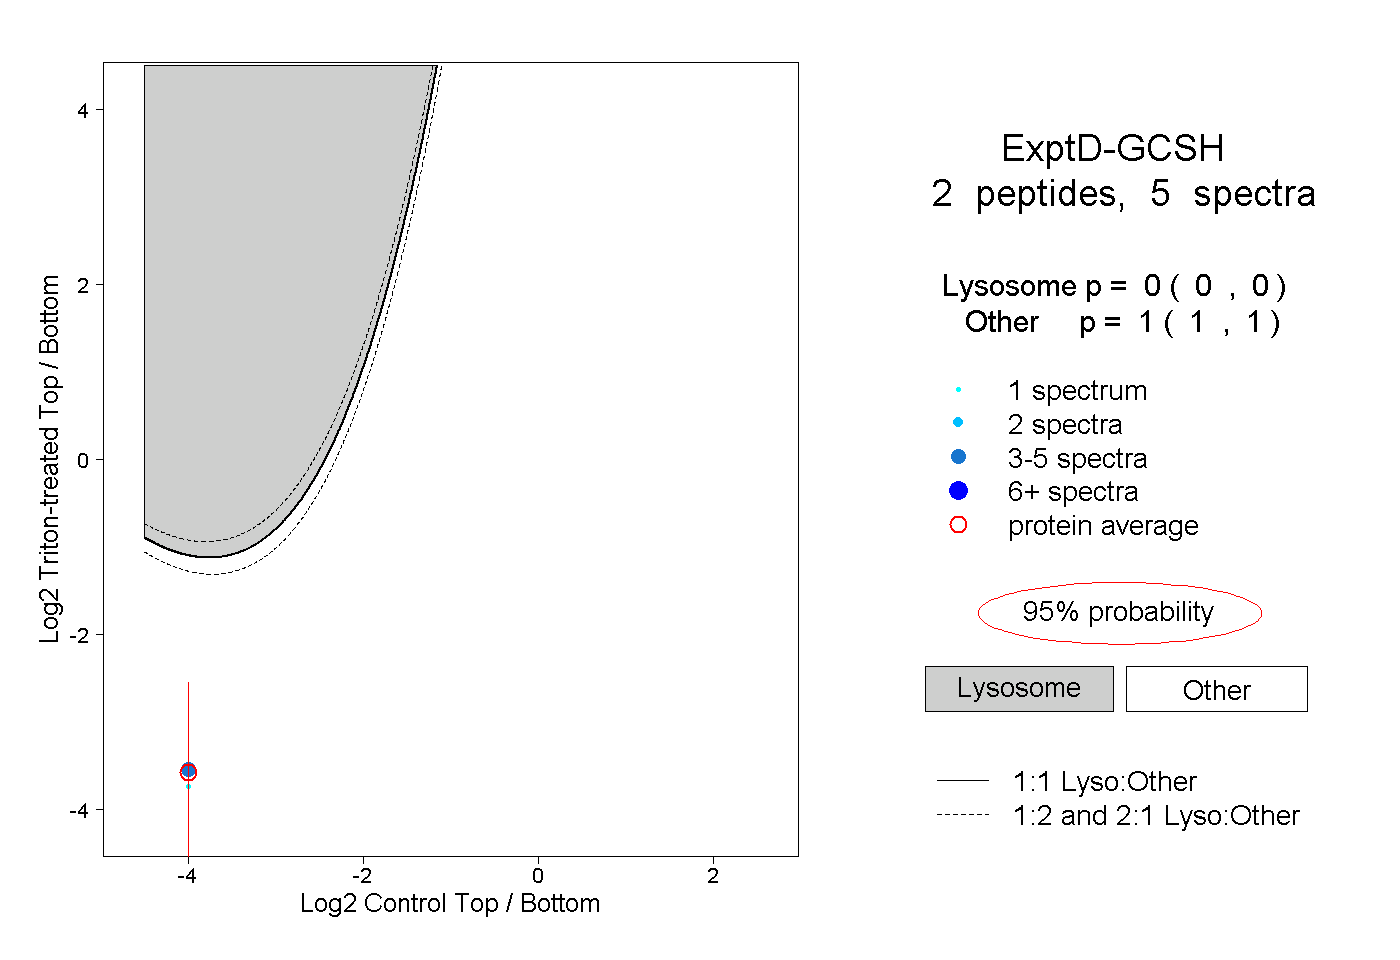
0.000 | 0.000
1.000 | 1.000